By Franck Pachot
.
![]()
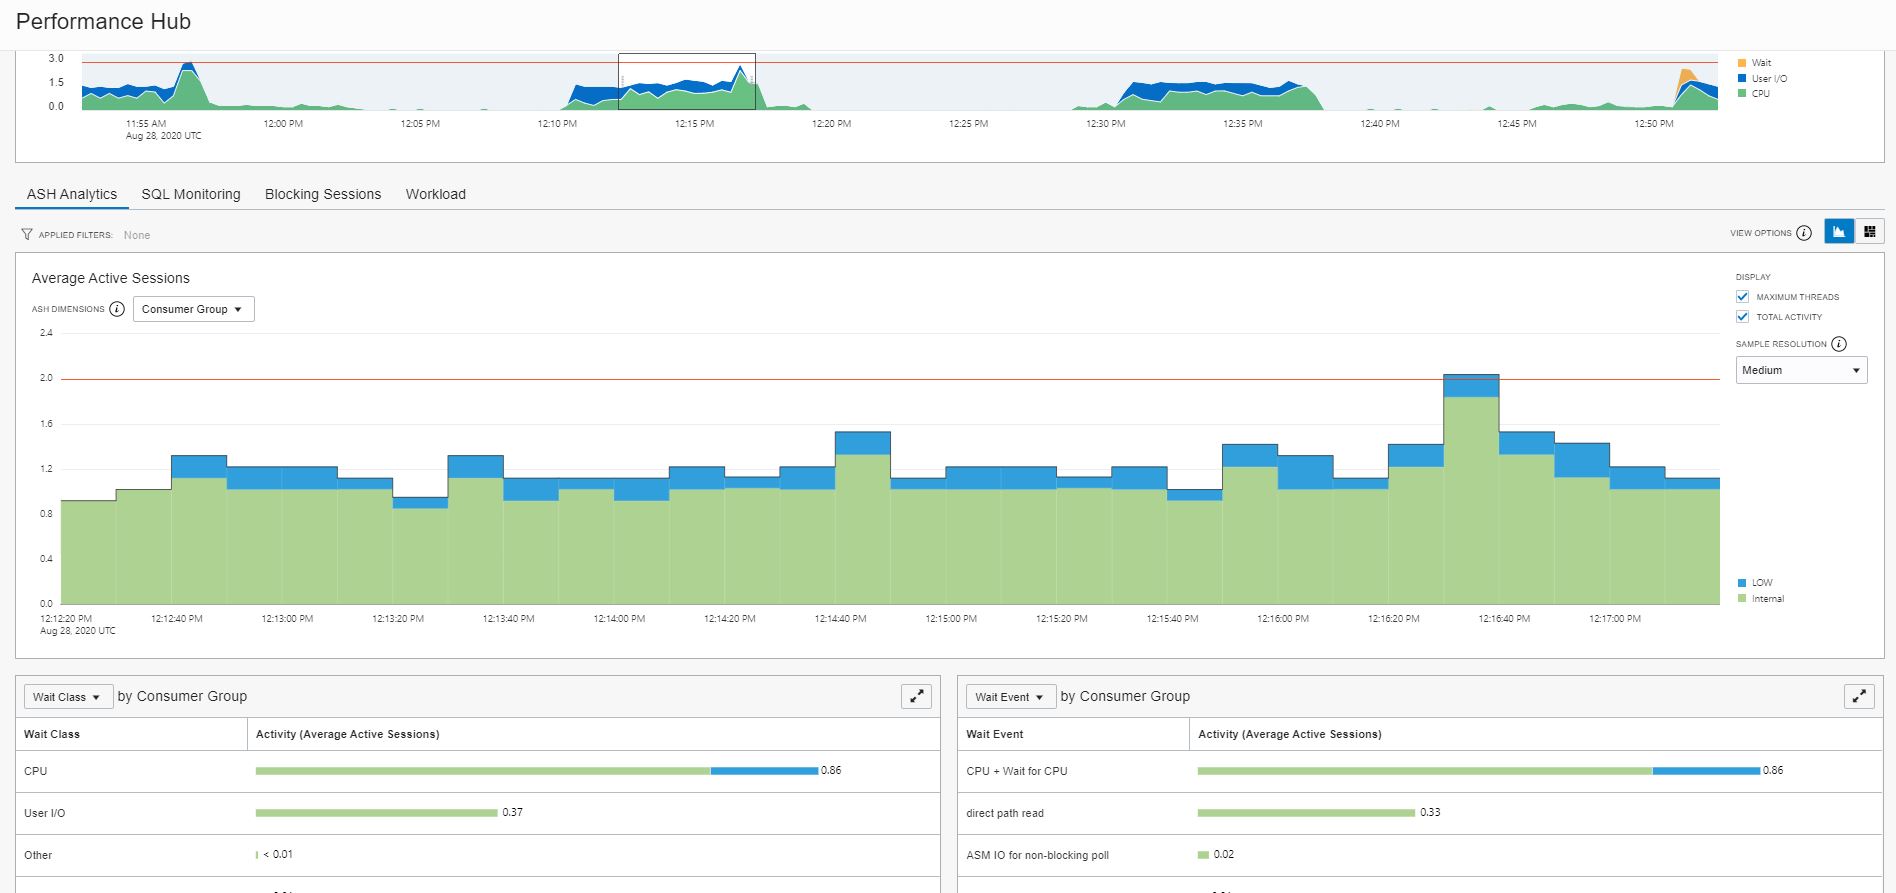
On my Oracle Cloud Free Tier Autonomous Transaction Processing service, a database that can be used for free with no time limit, I have seen this strange activity. As I’m running nothing scheduled, I was surprised by this pattern and looked at it by curiosity. And I got the idea to take some screenshot to show you how I look at those things. The easiest performance tool available in the Autonomous Database is the Performance Hub which shows the activity though time with detail on multiple dimensions for drill-down analysis. This is based on ASH of course.
In the upper pane, I focus on the part with homogenous activity because I may views the content without the timeline and then want to compare the activity metric (Average Active Session) with the peak I observed. Without this, I may start to look to something that is not significant and waste my time. Here, where the activity is about 1 active session, I want to drill-down on dimensions that account for around 0.8 active sessions to be sure to address 80% of the surprising activity. If the part selected includes some idle time around, I would not be able to do this easily.
![]()
The second pane let me drill-down either on 3 dimensions in a load map (we will see that later), or one main dimension with the time axis (in this screenshot the dimension is “Consumer Group”) with two other dimensions below displayed without the time detail, here “Wait Class” and “Wait Event”. This is where I want to compare the activity (0.86 average active session on CPU) to the load I’m looking at, as I don’t have the time to see peaks and idle periods.
- I see “Internal” for all “Session Attributes” ASH dimensions, like “Consumer Group”, “Module”, “Action”, “Client”, “Client Host Port”
- About “Session Identifiers” ASH dimensions, I still see “internal” for “User Session”, “User Name” and “Program”.
- “Parallel Process” shows “Serial” and “Session Type” shows “Foreground” which doesn’t give me more information
I have more information from “Resource Consumption”:
- ASH Dimension “Wait Class”: mostly “CPU” and some “User I/O”
- ASH Dimension “Wait Event”: the “User I/O” is “direct path read temp”
I’ll dig into those details later. There’s no direct detail for the CPU consumption. I’ll look at logical reads of course, and SQL Plan but I cannot directly match the CPU time with that. Especially from Average Active Session where I don’t have the CPU time – I have only samples there. It may be easier with “User I/O” because they should show up in other dimensions.
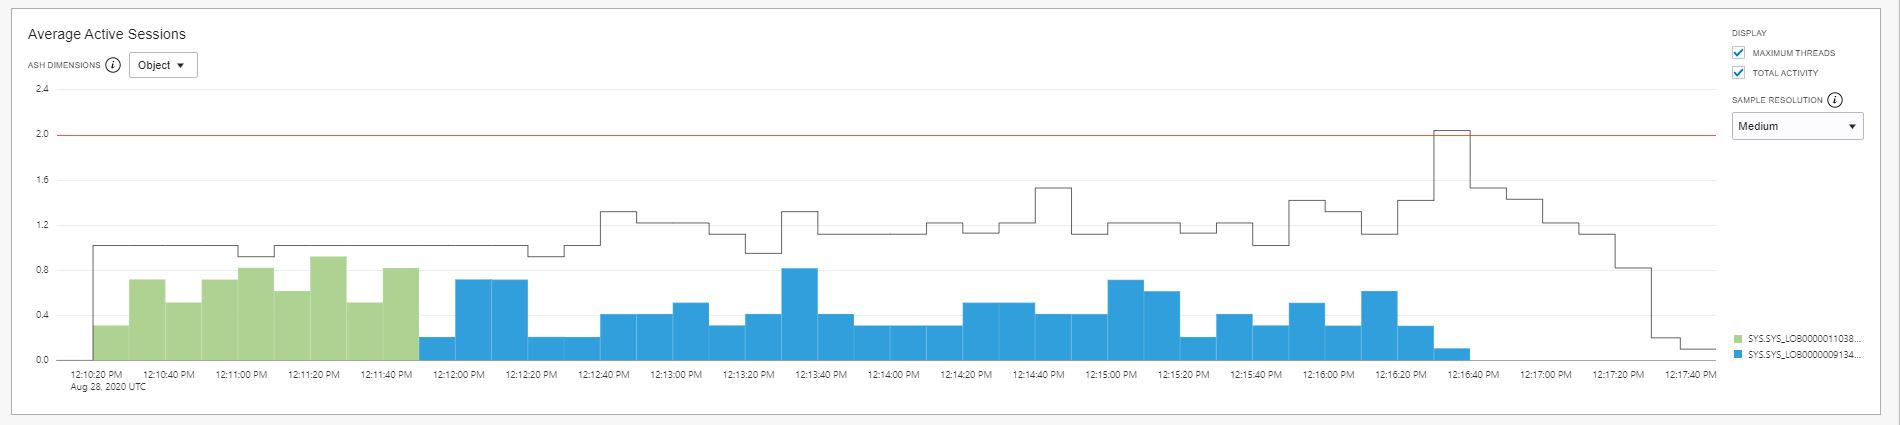
There are no “Blocking Session” but the ASH Dimension “Object” gives interesting information:
- ASH Dimension “Object”: SYS.SYS_LOB0000009134C00039$$ and SYS.SYS_LOB0000011038C00004$$ (LOB)
![]()
I don’t know an easy way to copy/paste from the Performance Hub so I have generated an AWR report and found them in the Top DB Objects section:
| Object ID |
% Activity |
Event |
% Event |
Object Name (Type) |
Tablespace |
Container Name |
| 9135 |
24.11 |
direct path read |
24.11 |
SYS.SYS_LOB0000009134C00039$$ (LOB) |
SYSAUX |
SUULFLFCSYX91Z0_ATP1 |
| 11039 |
10.64 |
direct path read |
10.64 |
SYS.SYS_LOB0000011038C00004$$ (LOB) |
SYSAUX |
SUULFLFCSYX91Z0_ATP1 |
That’s the beauty of ASH. In addition, to show you the load per multiple dimensions, it links all dimensions. Here, without guessing, I know that those objects are responsible for the “direct path read temp” I have seen above.
Let me insist on the numbers. I mentioned that I selected, in the upper chart, a homogeneous activity time window in order to compare the activity number with and without the time axis. My total activity during this time window is a little bit over 1 session active (on average, AAS – Average Active Session). I can see this on the time chart y-axis. And I confirm it if I sum-up the aggregations on other dimensions. Like above CPU + USER I/O was 0.86 + 0.37 =1.23 when the selected part was around 1.25 active sessions. Here when looking at “Object” dimension, I see around 0.5 sessions on SYS_LOB0000011038C00004$$ (green) during one minute, then around 0.3 sessions on SYS_LOB0000009134C00039$$ (blue) for 5 minutes and no activity on objects during 1 minute. That matches approximately the 0.37 AAS on User I/O. From the AWR report this is displayed as “% Event” and 24.11 + 10.64 = 34.75% which is roughly the ratio of those 0.37 to 1.25 we had with Average Active Sessions. When looking at sampling activity details, it is important to keep in mind the weight of each component we look at.
Let’s get more detail about those objects, from SQL Developer Web, or any connection:
DEMO@atp1_tp> select owner,object_name,object_type,oracle_maintained from dba_objects
where owner='SYS' and object_name in ('SYS_LOB0000009134C00039$$','SYS_LOB0000011038C00004$$');

   OWNER                  OBJECT_NAME    OBJECT_TYPE    ORACLE_MAINTAINED
________ ____________________________ ______________ ____________________
SYS      SYS_LOB0000009134C00039$$    LOB            Y
SYS      SYS_LOB0000011038C00004$$    LOB            Y

DEMO@atp1_tp> select owner,table_name,column_name,segment_name,tablespace_name from dba_lobs
where owner='SYS' and segment_name in ('SYS_LOB0000009134C00039$$','SYS_LOB0000011038C00004$$');

   OWNER                TABLE_NAME    COLUMN_NAME                 SEGMENT_NAME    TABLESPACE_NAME
________ _________________________ ______________ ____________________________ __________________
SYS      WRI$_SQLSET_PLAN_LINES    OTHER_XML      SYS_LOB0000009134C00039$$    SYSAUX
SYS      WRH$_SQLTEXT              SQL_TEXT       SYS_LOB0000011038C00004$$    SYSAUX
Ok, that’s interesting information. It confirms why I see ‘internal’ everywhere: those are dictionary tables.
WRI$_SQLSET_PLAN_LINES is about SQL Tuning Sets and in 19c, especially with the Auto Index feature, the SQL statements are captured every 15 minutes and analyzed to find index candidates. A look at SQL Tuning Sets confirms this:
DEMO@atp1_tp> select sqlset_name,parsing_schema_name,count(*),dbms_xplan.format_number(sum(length(sql_text))),min(plan_timestamp)
from dba_sqlset_statements group by parsing_schema_name,sqlset_name order by count(*);


    SQLSET_NAME    PARSING_SCHEMA_NAME    COUNT(*)    DBMS_XPLAN.FORMAT_NUMBER(SUM(LENGTH(SQL_TEXT)))    MIN(PLAN_TIMESTAMP)
_______________ ______________________ ___________ __________________________________________________ ______________________
SYS_AUTO_STS    C##OMLIDM                        1 53                                                 30-APR-20
SYS_AUTO_STS    FLOWS_FILES                      1 103                                                18-JUL-20
SYS_AUTO_STS    DBSNMP                           6 646                                                26-MAY-20
SYS_AUTO_STS    XDB                              7 560                                                20-MAY-20
SYS_AUTO_STS    ORDS_PUBLIC_USER                 9 1989                                               30-APR-20
SYS_AUTO_STS    GUEST0001                       10 3656                                               20-MAY-20
SYS_AUTO_STS    CTXSYS                          12 1193                                               20-MAY-20
SYS_AUTO_STS    LBACSYS                         28 3273                                               30-APR-20
SYS_AUTO_STS    AUDSYS                          29 3146                                               26-MAY-20
SYS_AUTO_STS    ORDS_METADATA                   29 4204                                               20-MAY-20
SYS_AUTO_STS    C##ADP$SERVICE                  33 8886                                               11-AUG-20
SYS_AUTO_STS    MDSYS                           39 4964                                               20-MAY-20
SYS_AUTO_STS    DVSYS                           65 8935                                               30-APR-20
SYS_AUTO_STS    APEX_190200                    130 55465                                              30-APR-20
SYS_AUTO_STS    C##CLOUD$SERVICE               217 507K                                               30-APR-20
SYS_AUTO_STS    ADMIN                          245 205K                                               30-APR-20
SYS_AUTO_STS    DEMO                           628 320K                                               30-APR-20
SYS_AUTO_STS    APEX_200100                  2,218 590K                                               18-JUL-20
SYS_AUTO_STS    SYS                        106,690 338M                                               30-APR-20
All gathered by this SYS_AUTO_STS job. And the statements captured were parsed by SYS – a system job has hard work because of system statements, as I mentioned when seeing this for the first time:
With this drill-down from the “Object” dimension, I’ve already gone far enough to get an idea about the problem: an internal job is reading the huge SQL Tuning Sets that have been collected by the Auto STS job introduced in 19c (and used by Auto Index). But I’ll continue to look at all other ASH Dimensions. They can give me more detail or at least confirm my guesses. That’s the idea: you look at all the dimensions and once one gives you interesting information, you dig down to more details.
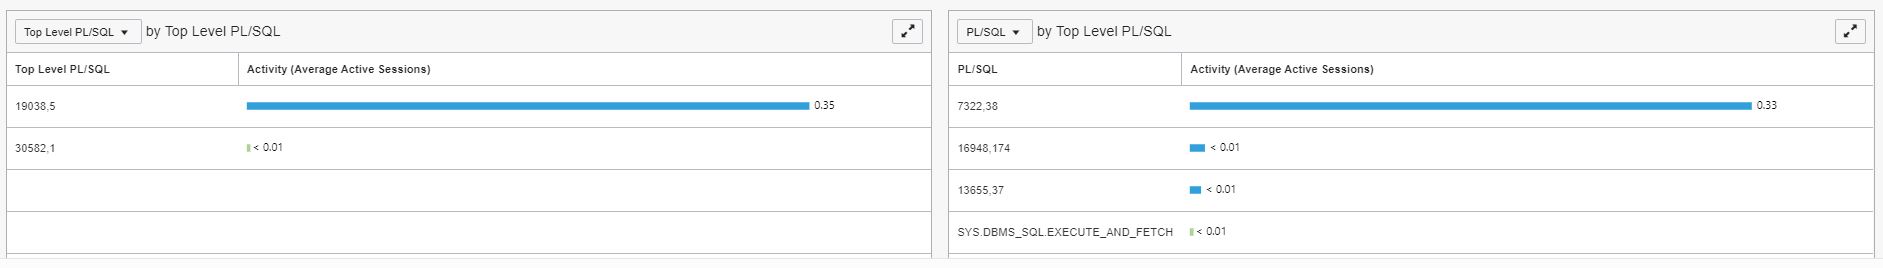
I look at “PL/SQL” ASH dimension first because an application should call SQL from procedural code and not the opposite. And, as all this is internal, developed by Oracle, I expect they do it this way.
- ASH Dimension “PL/SQL”: I see ‘7322,38’
- ASH Dimension “Top PL/SQL”: I see ‘19038,5’
![]()
Again, I copy/paste to avoid typos and got them from the AWR report “Top PL/SQL Procedures” section:
| PL/SQL Entry Subprogram |
% Activity |
PL/SQL Current Subprogram |
% Current |
Container Name |
| UNKNOWN_PLSQL_ID <19038, 5> |
78.72 |
SQL |
46.81 |
SUULFLFCSYX91Z0_ATP1 |
|
UNKNOWN_PLSQL_ID <19038,5>
|
78.72
|
UNKNOWN_PLSQL_ID <7322, 38> |
31.21 |
SUULFLFCSYX91Z0_ATP1 |
| UNKNOWN_PLSQL_ID <13644, 332> |
2.13 |
SQL |
2.13 |
SUULFLFCSYX91Z0_ATP1 |
| UNKNOWN_PLSQL_ID <30582, 1> |
1.42 |
SQL |
1.42 |
SUULFLFCSYX91Z0_ATP1 |
Side note on the number: activity was 0.35 AAS on top-level PL/SQL, 0.33 on current PL/SQL. 0.33 is included within 0.35 as a session active on a PL/SQL call. In AWR (where “Entry” means “top-level”) you see them nested and including the SQL activity. This is why you see 78.72% here, it is SQL + PL/SQL executed under the top-level call. But actually, the procedure (7322,38) is 31.21% if the total AAS, which matches the 0.33 AAS.
By the way, I didn’t mention it before but this in AWR report is actually an ASH report that is included in the AWR html report.
Now trying to know which are those procedures. I think the “UNKNOWN” comes from not finding it in the packages procedures:
DEMO@atp1_tp> select * from dba_procedures where (object_id,subprogram_id) in ( (7322,38) , (19038,5) );

no rows selected
but I find them from DBA_OBJECTS:
DEMO@atp1_tp> select owner,object_name,object_id,object_type,oracle_maintained,last_ddl_time from dba_objects where object_id in (7322,19038);

   OWNER           OBJECT_NAME    OBJECT_ID    OBJECT_TYPE    ORACLE_MAINTAINED    LAST_DDL_TIME
________ _____________________ ____________ ______________ ____________________ ________________
SYS      XMLTYPE                      7,322 TYPE           Y                    18-JUL-20
SYS      DBMS_AUTOTASK_PRVT          19,038 PACKAGE        Y                    22-MAY-20
and DBA_PROCEDURES:
DEMO@atp1_tp> select owner,object_name,procedure_name,object_id,subprogram_id from dba_procedures where object_id in(7322,19038);


   OWNER                   OBJECT_NAME    PROCEDURE_NAME    OBJECT_ID    SUBPROGRAM_ID
________ _____________________________ _________________ ____________ ________________
SYS      DBMS_RESULT_CACHE_INTERNAL    RELIES_ON               19,038                1
SYS      DBMS_RESULT_CACHE_INTERNAL                            19,038                0
All this doesn’t match ![🙁]()
My guess is that the top level PL/SQL object is DBMS_AUTOTASK_PRVT as I can see in the container it is running on, which is the one I’m connected to (an autonomous database is a pluggable database in the Oracle Cloud container database). It has the OBJECT_ID=19038 in my PDB. But the DBA_PROCEDURES is an extended data link and the OBJECT_ID of common objects are different in CDB$ROOT and PDBs. And OBJECT_ID=7322 is probably an identifier in CDB$ROOT, where active session monitoring runs. I cannot verify as I have only a local user. Because of this inconsistency, my drill-down on the PL/SQL dimension stops there.
The package calls some SQL and from browsing the AWR report I’ve seen in the time model that “sql execute elapsed time” is the major component:
| Statistic Name |
Time (s) |
% of DB Time |
% of Total CPU Time |
| sql execute elapsed time |
1,756.19 |
99.97 |
|
| DB CPU |
1,213.59 |
69.08 |
94.77 |
| PL/SQL execution elapsed time |
498.62 |
28.38 |
|
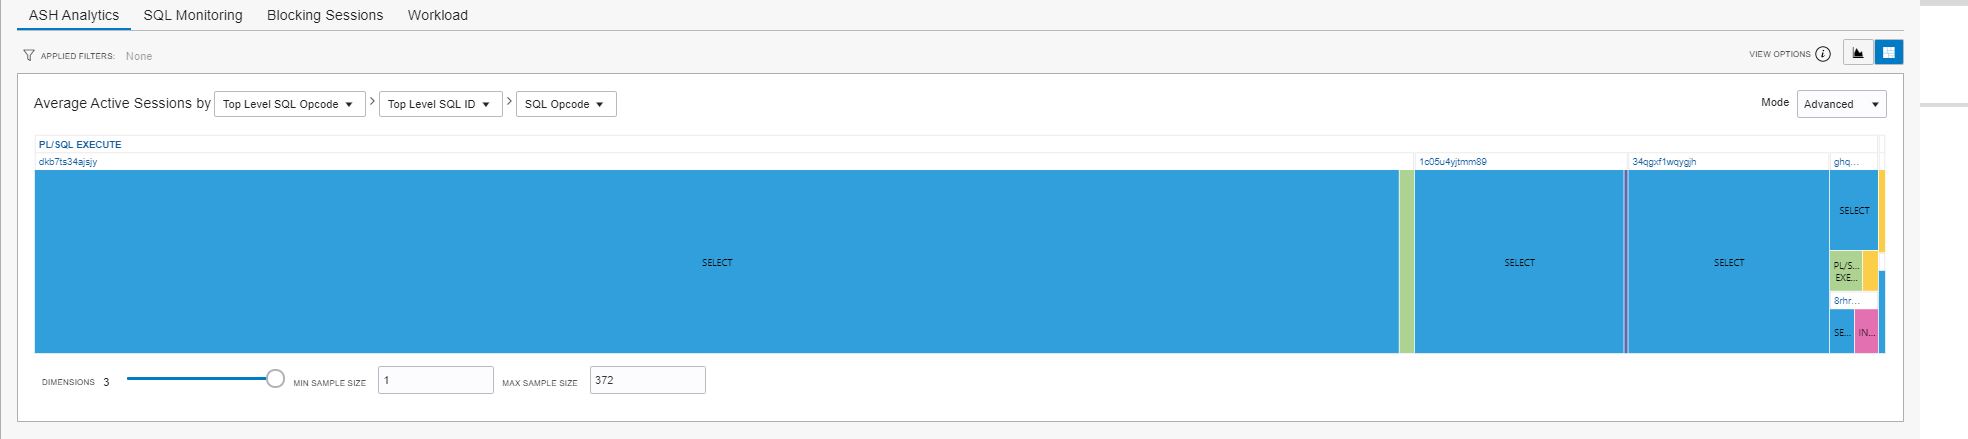
I’ll follow the hierarchy of this dimension – the most detailed will be the SQL Plan operation. But let’s start with “SQL Opcode”
![]()
- ASH Dimension “Top Level Opcode”: mostly “PL/SQL EXECUTE” which confirms that the SQL I’ll see is called by the PL/SQL.
- ASH Dimension “top level SQL ID”: mostly dkb7ts34ajsjy here. I’ll look at its details further.
From the AWR report, I see all statements with no distinction about the top level one, and there’s no spinning top to help you find what is running as a recursive call or the top-level one. It can be often guessed from the time and other statistics – here I have 3 queries taking almost the same database time:
| Elapsed Time (s) |
Executions |
Elapsed Time per Exec (s) |
%Total |
%CPU |
%IO |
SQL Id |
SQL Module |
SQL Text |
| 1,110.86 |
3 |
370.29 |
63.24 |
61.36 |
50.16 |
dkb7ts34ajsjy |
DBMS_SCHEDULER |
DECLARE job BINARY_INTEGER := … |
| 1,110.85 |
3 |
370.28 |
63.24 |
61.36 |
50.16 |
f6j6vuum91fw8 |
DBMS_SCHEDULER |
begin /*KAPI:task_proc*/ dbms_… |
| 1,087.12 |
3 |
362.37 |
61.88 |
61.65 |
49.93 |
0y288pk81u609 |
SYS_AI_MODULE |
SELECT /*+dynamic_sampling(11)… |
![]()
SYS_AI_MODULE is the Auto Indexing feature
DEMO@atp1_tp> select distinct sql_id,sql_text from v$sql where sql_id in ('dkb7ts34ajsjy','f6j6vuum91fw8','0y288pk81u609');
dkb7ts34ajsjy    DECLARE job BINARY_INTEGER := :job;  next_date TIMESTAMP WITH TIME ZONE := :mydate;  broken BOOLEAN := FALSE;  job_name VARCHAR2(128) := :job_name;  job_subname VARCHAR2(128) := :job_subname;  job_owner VARCHAR2(128) := :job_owner;  job_start TIMESTAMP WITH TIME ZONE := :job_start;  job_scheduled_start TIMESTAMP WITH TIME ZONE := :job_scheduled_start;  window_start TIMESTAMP WITH TIME ZONE := :window_start;  window_end TIMESTAMP WITH TIME ZONE := :window_end;  chain_id VARCHAR2(14) :=  :chainid;  credential_owner VARCHAR2(128) := :credown;  credential_name  VARCHAR2(128) := :crednam;  destination_owner VARCHAR2(128) := :destown;  destination_name VARCHAR2(128) := :destnam;  job_dest_id varchar2(14) := :jdestid;  log_id number := :log_id;  BEGIN  begin dbms_autotask_prvt.run_autotask(3, 0);  end;  :mydate := next_date; IF broken THEN :b := 1; ELSE :b := 0; END IF; END;
f6j6vuum91fw8    begin /*KAPI:task_proc*/ dbms_auto_index_internal.task_proc(FALSE); end;
0y288pk81u609    SELECT /*+dynamic_sampling(11) NO_XML_QUERY_REWRITE */ SQL_ID, PLAN_HASH_VALUE, ELAPSED_TIME/EXECUTIONS ELAPSED_PER_EXEC, DBMS_AUTO_INDEX_INTERNAL.AUTO_INDEX_ALLOW(CE) SESSION_TYPE FROM (SELECT SQL_ID, PLAN_HASH_VALUE, MIN(ELAPSED_TIME) ELAPSED_TIME, MIN(EXECUTIONS) EXECUTIONS, MIN(OPTIMIZER_ENV) CE, MAX(EXISTSNODE(XMLTYPE(OTHER_XML), '/other_xml/info[@type = "has_user_tab"]')) USER_TAB FROM (SELECT F.NAME AS SQLSET_NAME, F.OWNER AS SQLSET_OWNER, SQLSET_ID, S.SQL_ID, T.SQL_TEXT, S.COMMAND_TYPE, P.PLAN_HASH_VALUE, SUBSTRB(S.MODULE, 1, (SELECT KSUMODLEN FROM X$MODACT_LENGTH)) MODULE, SUBSTRB(S.ACTION, 1, (SELECT KSUACTLEN FROM X$MODACT_LENGTH)) ACTION, C.ELAPSED_TIME, C.BUFFER_GETS, C.EXECUTIONS, C.END_OF_FETCH_COUNT, P.OPTIMIZER_ENV, L.OTHER_XML FROM WRI$_SQLSET_DEFINITIONS F, WRI$_SQLSET_STATEMENTS S, WRI$_SQLSET_PLANS P,WRI$_SQLSET_MASK M, WRH$_SQLTEXT T, WRI$_SQLSET_STATISTICS C, WRI$_SQLSET_PLAN_LINES L WHERE F.ID = S.SQLSET_ID AND S.ID = P.STMT_ID AND S.CON_DBID = P.CON_DBID AND P.
It looks like dbms_autotask_prvt.run_autotask calls dbms_auto_index_internal.task_proc that queries WRI$_SQLSET tables and this is where all the database time goes.
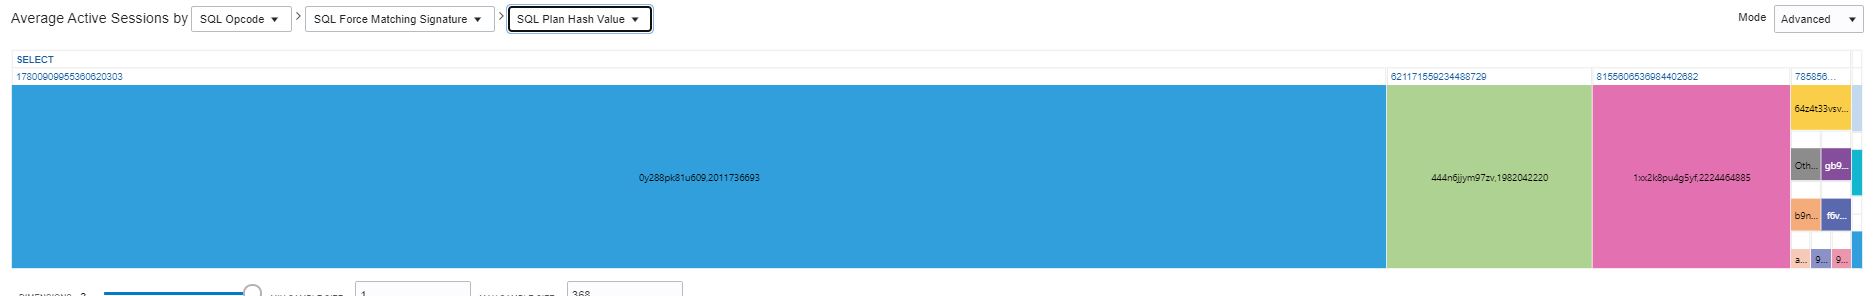
- ASH Dimension “SQL Opcode”: most of SELECT statements here
- ASH Dimension “SQL Force Matching Signature” is interesting to group all statements that differ only by literals.
- ASH Dimension “SQL Plan Hash Value”, and the more detailed “SQL Full Plan Hash Value”, are interesting to group all statements having the same execution plan shape, or exactly the same execution plan
![]()
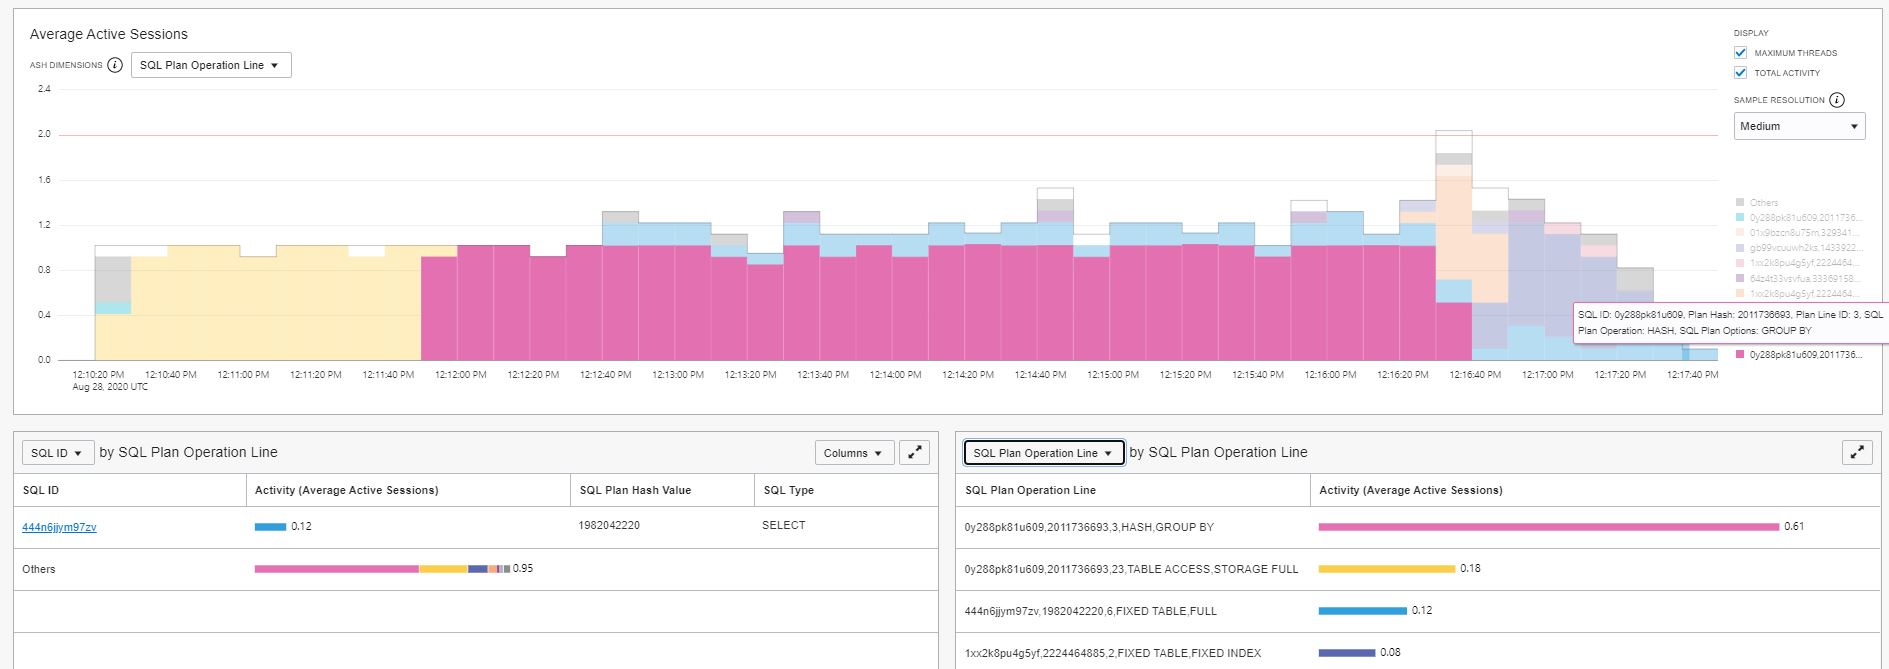
- ASH Dimension “SQL ID” is the most interesting here to see which of this SELECT query is seen most of the time below this Top Level call, but unfortunately, I see “internal here”. Fortunately, the AWR report above did not hide this.
- ASH Dimension “SQL Plan Operation” shows me that within this query I’m spending time on HASH GROUP BY operation (which, is the workarea is large, does some “direct path read temp” as we encountered on the “wait event” dimension)
- ASH Dimension “SQL Plan Operation Line” helps me to find this operation in the plan as in addition to the SQL_ID (the one that was hidden in the “SQL_ID” dimension) I have the plan identification (plan hash value) and plan line number.
Again, I use the graphical Performance Hub to find where I need to drill down and find all details in the AWR report “Top SQL with Top Events” section:
| SQL ID |
Plan Hash |
Executions |
% Activity |
Event |
% Event |
Top Row Source |
% Row Source |
SQL Text |
| 0y288pk81u609 |
2011736693 |
3 |
70.21 |
CPU + Wait for CPU |
35.46 |
HASH – GROUP BY |
28.37 |
SELECT /*+dynamic_sampling(11)… |
|
0y288pk81u609
|
2011736693
|
3
|
70.21
|
direct path read |
34.75 |
HASH – GROUP BY |
24.11 |
|
| 444n6jjym97zv |
1982042220 |
18 |
12.77 |
CPU + Wait for CPU |
12.77 |
FIXED TABLE – FULL |
12.77 |
SELECT /*+ unnest */ * FROM GV… |
| 1xx2k8pu4g5yf |
2224464885 |
2 |
5.67 |
CPU + Wait for CPU |
5.67 |
FIXED TABLE – FIXED INDEX |
2.84 |
SELECT /*+ first_rows(1) */ s… |
| 3kqrku32p6sfn |
3786872576 |
3 |
2.13 |
CPU + Wait for CPU |
2.13 |
FIXED TABLE – FULL |
2.13 |
MERGE /*+ OPT_PARAM(‘_parallel… |
| 64z4t33vsvfua |
3336915854 |
2 |
1.42 |
CPU + Wait for CPU |
1.42 |
FIXED TABLE – FIXED INDEX |
0.71 |
WITH LAST_HOUR AS ( SELECT ROU… |
I can see the full SQL Text in the AWR report and get the AWR statement report with dbms_workload_repository. I can also fetch the plan with DBMS_XPLAN.DISPLAY_AWR:
DEMO@atp1_tp> select * from dbms_xplan.display_awr('0y288pk81u609',2011736693,null,'+peeked_binds');


                                                                                                              PLAN_TABLE_OUTPUT
_______________________________________________________________________________________________________________________________
SQL_ID 0y288pk81u609
--------------------
SELECT /*+dynamic_sampling(11) NO_XML_QUERY_REWRITE */ SQL_ID,
PLAN_HASH_VALUE, ELAPSED_TIME/EXECUTIONS ELAPSED_PER_EXEC,
DBMS_AUTO_INDEX_INTERNAL.AUTO_INDEX_ALLOW(CE) SESSION_TYPE FROM (SELECT
SQL_ID, PLAN_HASH_VALUE, MIN(ELAPSED_TIME) ELAPSED_TIME,
MIN(EXECUTIONS) EXECUTIONS, MIN(OPTIMIZER_ENV) CE,
MAX(EXISTSNODE(XMLTYPE(OTHER_XML), '/other_xml/info[@type =
"has_user_tab"]')) USER_TAB FROM (SELECT F.NAME AS SQLSET_NAME, F.OWNER
AS SQLSET_OWNER, SQLSET_ID, S.SQL_ID, T.SQL_TEXT, S.COMMAND_TYPE,
P.PLAN_HASH_VALUE, SUBSTRB(S.MODULE, 1, (SELECT KSUMODLEN FROM
X$MODACT_LENGTH)) MODULE, SUBSTRB(S.ACTION, 1, (SELECT KSUACTLEN FROM
X$MODACT_LENGTH)) ACTION, C.ELAPSED_TIME, C.BUFFER_GETS, C.EXECUTIONS,
C.END_OF_FETCH_COUNT, P.OPTIMIZER_ENV, L.OTHER_XML FROM
WRI$_SQLSET_DEFINITIONS F, WRI$_SQLSET_STATEMENTS S, WRI$_SQLSET_PLANS
P,WRI$_SQLSET_MASK M, WRH$_SQLTEXT T, WRI$_SQLSET_STATISTICS C,
WRI$_SQLSET_PLAN_LINES L WHERE F.ID = S.SQLSET_ID AND S.ID = P.STMT_ID
AND S.CON_DBID = P.CON_DBID AND P.STMT_ID = C.STMT_ID AND
P.PLAN_HASH_VALUE = C.PLAN_HASH_VALUE AND P.CON_DBID = C.CON_DBID AND
P.STMT_ID = M.STMT_ID AND P.PLAN_HASH_VALUE = M.PLAN_HASH_VALUE AND
P.CON_DBID = M.CON_DBID AND S.SQL_ID = T.SQL_ID AND S.CON_DBID =
T.CON_DBID AND T.DBID = F.CON_DBID AND P.STMT_ID=L.STMT_ID AND
P.PLAN_HASH_VALUE = L.PLAN_HASH_VALUE AND P.CON_DBID = L.CON_DBID) S,
WRI$_ADV_OBJECTS OS WHERE SQLSET_OWNER = :B8 AND SQLSET_NAME = :B7 AND
(MODULE IS NULL OR (MODULE != :B6 AND MODULE != :B5 )) AND SQL_TEXT NOT
LIKE 'SELECT /* DS_SVC */%' AND SQL_TEXT NOT LIKE 'SELECT /*
OPT_DYN_SAMP */%' AND SQL_TEXT NOT LIKE '/*AUTO_INDEX:ddl*/%' AND
SQL_TEXT NOT LIKE '%/*+%dbms_stats%' AND COMMAND_TYPE NOT IN (9, 10,
11) AND PLAN_HASH_VALUE > 0 AND BUFFER_GETS > 0 AND EXECUTIONS > 0 AND
OTHER_XML IS NOT NULL AND OS.SQL_ID_VC (+)= S.SQL_ID AND OS.TYPE (+)=
:B4 AND DECODE(OS.TYPE(+), :B4 , TO_NUMBER(OS.ATTR2(+)), -1) =
S.PLAN_HASH_VALUE AND OS.TASK_ID (+)= :B3 AND OS.EXEC_NAME (+) IS NULL
AND (OS.SQL_ID_VC IS NULL OR TO_DATE(OS.ATTR18, :B2 )  0 ORDER BY
DBMS_AUTO_INDEX_INTERNAL.AUTO_INDEX_ALLOW(CE) DESC, ELAPSED_TIME DESC

Plan hash value: 2011736693

----------------------------------------------------------------------------------------------------------------------------
| Id  | Operation                                 | Name                           | Rows  | Bytes | Cost (%CPU)| Time     |
----------------------------------------------------------------------------------------------------------------------------
|   0 | SELECT STATEMENT                          |                                |       |       |   957 (100)|          |
|   1 |  SORT ORDER BY                            |                                |   180 |   152K|   957  (18)| 00:00:01 |
|   2 |   FILTER                                  |                                |       |       |            |          |
|   3 |    HASH GROUP BY                          |                                |   180 |   152K|   957  (18)| 00:00:01 |
|   4 |     NESTED LOOPS                          |                                |  3588 |  3030K|   955  (18)| 00:00:01 |
|   5 |      FILTER                               |                                |       |       |            |          |
|   6 |       HASH JOIN RIGHT OUTER               |                                |  3588 |  2964K|   955  (18)| 00:00:01 |
|   7 |        TABLE ACCESS BY INDEX ROWID BATCHED| WRI$_ADV_OBJECTS               |     1 |    61 |     4   (0)| 00:00:01 |
|   8 |         INDEX RANGE SCAN                  | WRI$_ADV_OBJECTS_IDX_02        |     1 |       |     3   (0)| 00:00:01 |
|   9 |        HASH JOIN                          |                                |  3588 |  2750K|   951  (18)| 00:00:01 |
|  10 |         TABLE ACCESS STORAGE FULL         | WRI$_SQLSET_PLAN_LINES         | 86623 |  2706K|   816  (19)| 00:00:01 |
|  11 |         HASH JOIN                         |                                |  3723 |  2737K|   134   (8)| 00:00:01 |
|  12 |          TABLE ACCESS STORAGE FULL        | WRI$_SQLSET_STATISTICS         | 89272 |  2789K|    21  (10)| 00:00:01 |
|  13 |          HASH JOIN                        |                                |  3744 |  2636K|   112   (7)| 00:00:01 |
|  14 |           JOIN FILTER CREATE              | :BF0000                        |  2395 |   736K|    39  (13)| 00:00:01 |
|  15 |            HASH JOIN                      |                                |  2395 |   736K|    39  (13)| 00:00:01 |
|  16 |             TABLE ACCESS STORAGE FULL     | WRI$_SQLSET_STATEMENTS         |  3002 |   137K|    13  (24)| 00:00:01 |
|  17 |              FIXED TABLE FULL             | X$MODACT_LENGTH                |     1 |     5 |     0   (0)|          |
|  18 |              FIXED TABLE FULL             | X$MODACT_LENGTH                |     1 |     5 |     0   (0)|          |
|  19 |              FIXED TABLE FULL             | X$MODACT_LENGTH                |     1 |     5 |     0   (0)|          |
|  20 |             NESTED LOOPS                  |                                |  1539 |   402K|    25   (4)| 00:00:01 |
|  21 |              TABLE ACCESS BY INDEX ROWID  | WRI$_SQLSET_DEFINITIONS        |     1 |    27 |     1   (0)| 00:00:01 |
|  22 |               INDEX UNIQUE SCAN           | WRI$_SQLSET_DEFINITIONS_IDX_01 |     1 |       |     0   (0)|          |
|  23 |              TABLE ACCESS STORAGE FULL    | WRH$_SQLTEXT                   |  1539 |   362K|    24   (5)| 00:00:01 |
|  24 |           JOIN FILTER USE                 | :BF0000                        | 89772 |    34M|    73   (3)| 00:00:01 |
|  25 |            TABLE ACCESS STORAGE FULL      | WRI$_SQLSET_PLANS              | 89772 |    34M|    73   (3)| 00:00:01 |
|  26 |      INDEX UNIQUE SCAN                    | WRI$_SQLSET_MASK_PK            |     1 |    19 |     0   (0)|          |
----------------------------------------------------------------------------------------------------------------------------

Hint Report (identified by operation id / Query Block Name / Object Alias):
Total hints for statement: 7 (U - Unused (7))
---------------------------------------------------------------------------

   0 -  SEL$5
         U -  MERGE(@"SEL$5" >"SEL$4") / duplicate hint
         U -  MERGE(@"SEL$5" >"SEL$4") / duplicate hint

   1 -  SEL$5C160134
         U -  dynamic_sampling(11) / rejected by IGNORE_OPTIM_EMBEDDED_HINTS

  17 -  SEL$7286615E
         U -  PUSH_SUBQ(@"SEL$7286615E") / duplicate hint
         U -  PUSH_SUBQ(@"SEL$7286615E") / duplicate hint

  17 -  SEL$7286615E / X$MODACT_LENGTH@SEL$5
         U -  FULL(@"SEL$7286615E" "X$MODACT_LENGTH"@"SEL$5") / duplicate hint
         U -  FULL(@"SEL$7286615E" "X$MODACT_LENGTH"@"SEL$5") / duplicate hint

Peeked Binds (identified by position):
--------------------------------------

   1 - :B8 (VARCHAR2(30), CSID=873): 'SYS'
   2 - :B7 (VARCHAR2(30), CSID=873): 'SYS_AUTO_STS'
   5 - :B4 (NUMBER): 7
   7 - :B3 (NUMBER): 15

Note
-----
   - SQL plan baseline SQL_PLAN_gf2c99a3zrzsge1b441a5 used for this statement
I can confirm what I’ve seen about HASH GROUP BY on line ID=3
I forgot to mention that SQL Monitor is not available for this query probably because it is disabled for internal queries. Anyway, the most interesting here is that the plan comes from SQL Plan Management
Here is more information about this SQL Plan Baseline:
DEMO@atp1_tp> select * from dbms_xplan.display_sql_plan_baseline('','SQL_PLAN_gf2c99a3zrzsge1b441a5');
                                                                                                                  ...
--------------------------------------------------------------------------------
SQL handle: SQL_f709894a87fbff0f
SQL text: SELECT /*+dynamic_sampling(11) NO_XML_QUERY_REWRITE */ SQL_ID,
          PLAN_HASH_VALUE, ELAPSED_TIME/EXECUTIONS ELAPSED_PER_EXEC,
...
--------------------------------------------------------------------------------
Plan name: SQL_PLAN_gf2c99a3zrzsge1b441a5         Plan id: 3786686885
Enabled: YES     Fixed: NO      Accepted: YES     Origin: AUTO-CAPTURE
Plan rows: From dictionary
--------------------------------------------------------------------------------
...
This shows only one plan, but I want to see all plans for this statement.
DEMO@atp1_tp> select
CREATOR,ORIGIN,CREATED,LAST_MODIFIED,LAST_EXECUTED,LAST_VERIFIED,ENABLED,ACCEPTED,FIXED,REPRODUCED
from dba_sql_plan_baselines where sql_handle='SQL_f709894a87fbff0f' order by created;


   CREATOR                           ORIGIN            CREATED      LAST_MODIFIED      LAST_EXECUTED      LAST_VERIFIED    ENABLED    ACCEPTED    FIXED    REPRODUCED
__________ ________________________________ __________________ __________________ __________________ __________________ __________ ___________ ________ _____________
SYS        EVOLVE-LOAD-FROM-AWR             30-MAY-20 11:50    30-JUL-20 23:34                       30-JUL-20 23:34    YES        NO          NO       YES
SYS        EVOLVE-LOAD-FROM-AWR             30-MAY-20 11:50    31-JUL-20 05:03                       31-JUL-20 05:03    YES        NO          NO       YES
SYS        EVOLVE-LOAD-FROM-CURSOR-CACHE    30-MAY-20 11:50    31-JUL-20 06:09                       31-JUL-20 06:09    YES        NO          NO       YES
SYS        EVOLVE-LOAD-FROM-AWR             30-MAY-20 11:50    31-JUL-20 06:09                       31-JUL-20 06:09    YES        NO          NO       YES
SYS        AUTO-CAPTURE                     30-MAY-20 16:08    31-JUL-20 07:15                       31-JUL-20 07:15    YES        NO          NO       YES
SYS        AUTO-CAPTURE                     30-MAY-20 19:10    30-MAY-20 19:30    30-MAY-20 19:30    30-MAY-20 19:29    YES        YES         NO       YES
SYS        AUTO-CAPTURE                     30-MAY-20 19:30    31-JUL-20 08:21                       31-JUL-20 08:21    YES        NO          NO       YES
SYS        AUTO-CAPTURE                     30-MAY-20 23:32    31-JUL-20 08:21                       31-JUL-20 08:21    YES        NO          NO       YES
SYS        AUTO-CAPTURE                     31-MAY-20 03:14    31-JUL-20 08:21                       31-JUL-20 08:21    YES        NO          NO       YES
SYS        AUTO-CAPTURE                     31-MAY-20 04:14    31-JUL-20 08:21                       31-JUL-20 08:21    YES        NO          NO       YES
SYS        EVOLVE-LOAD-FROM-AWR             31-MAY-20 13:04    31-JUL-20 23:43                       31-JUL-20 23:43    YES        NO          NO       YES
SYS        AUTO-CAPTURE                     31-MAY-20 13:19    31-JUL-20 23:43                       31-JUL-20 23:43    YES        NO          NO       YES
SYS        AUTO-CAPTURE                     31-MAY-20 13:39    11-JUL-20 04:35    11-JUL-20 04:35    31-MAY-20 14:09    YES        YES         NO       YES
SYS        AUTO-CAPTURE                     31-MAY-20 18:01    10-AUG-20 22:05                       10-AUG-20 22:05    YES        NO          NO       YES
SYS        AUTO-CAPTURE                     31-MAY-20 22:44    10-AUG-20 22:05                       10-AUG-20 22:05    YES        NO          NO       YES
SYS        AUTO-CAPTURE                     01-JUN-20 06:48    10-AUG-20 22:05                       10-AUG-20 22:05    YES        NO          NO       YES
SYS        AUTO-CAPTURE                     01-JUN-20 07:09    10-AUG-20 22:05                       10-AUG-20 22:05    YES        NO          NO       YES
SYS        AUTO-CAPTURE                     02-JUN-20 05:22    02-JUN-20 05:49                       02-JUN-20 05:49    YES        YES         NO       YES
SYS        AUTO-CAPTURE                     02-JUN-20 21:52    10-AUG-20 22:06                       10-AUG-20 22:06    YES        NO          NO       YES
SYS        AUTO-CAPTURE                     03-JUN-20 08:20    23-AUG-20 20:45    23-AUG-20 20:45    03-JUN-20 08:49    YES        YES         NO       YES
SYS        AUTO-CAPTURE                     04-JUN-20 01:34    10-AUG-20 22:06                       10-AUG-20 22:06    YES        NO          NO       YES
SYS        AUTO-CAPTURE                     05-JUN-20 21:43    10-AUG-20 22:06                       10-AUG-20 22:06    YES        NO          NO       YES
SYS        AUTO-CAPTURE                     14-JUN-20 06:01    18-AUG-20 23:22    18-AUG-20 23:22    14-JUN-20 10:52    YES        YES         NO       YES
SYS        AUTO-CAPTURE                     14-JUN-20 06:21    13-AUG-20 22:35                       13-AUG-20 22:35    YES        NO          NO       YES
SYS        AUTO-CAPTURE                     27-JUN-20 16:43    27-AUG-20 22:11                       27-AUG-20 22:11    YES        NO          NO       YES
SYS        AUTO-CAPTURE                     28-JUN-20 02:09    28-JUN-20 06:52    28-JUN-20 06:52    28-JUN-20 06:41    YES        YES         NO       YES
SYS        AUTO-CAPTURE                     28-JUN-20 08:13    29-JUL-20 23:24                       29-JUL-20 23:24    YES        NO          NO       YES
SYS        AUTO-CAPTURE                     29-JUN-20 03:05    30-JUL-20 22:28                       30-JUL-20 22:28    YES        NO          NO       YES
SYS        AUTO-CAPTURE                     29-JUN-20 10:50    30-JUL-20 23:33                       30-JUL-20 23:33    YES        NO          NO       YES
SYS        AUTO-CAPTURE                     30-JUN-20 13:28    11-JUL-20 05:15    11-JUL-20 05:15    30-JUN-20 23:09    YES        YES         NO       YES
SYS        AUTO-CAPTURE                     01-JUL-20 14:04    31-JUL-20 22:37                       31-JUL-20 22:37    YES        NO          NO       YES
SYS        AUTO-CAPTURE                     11-JUL-20 06:36    10-AUG-20 22:07                       10-AUG-20 22:07    YES        NO          NO       YES
SYS        AUTO-CAPTURE                     11-JUL-20 14:00    11-AUG-20 22:06                       11-AUG-20 22:06    YES        NO          NO       YES
SYS        AUTO-CAPTURE                     12-JUL-20 00:47    11-AUG-20 22:06                       11-AUG-20 22:06    YES        NO          NO       YES
SYS        AUTO-CAPTURE                     12-JUL-20 01:47    11-AUG-20 22:06                       11-AUG-20 22:06    YES        NO          NO       YES
SYS        AUTO-CAPTURE                     12-JUL-20 09:52    13-AUG-20 22:34                       13-AUG-20 22:34    YES        NO          NO       YES
SYS        AUTO-CAPTURE                     13-JUL-20 04:03    13-AUG-20 22:34                       13-AUG-20 22:34    YES        NO          NO       YES
SYS        AUTO-CAPTURE                     18-JUL-20 12:15    17-AUG-20 22:15                       17-AUG-20 22:15    YES        NO          NO       YES
SYS        AUTO-CAPTURE                     18-JUL-20 23:43    18-AUG-20 22:44                       18-AUG-20 22:44    YES        NO          NO       YES
SYS        AUTO-CAPTURE                     24-JUL-20 01:38    23-AUG-20 06:24                       23-AUG-20 06:24    YES        NO          NO       YES
SYS        AUTO-CAPTURE                     24-JUL-20 06:42    24-AUG-20 22:09                       24-AUG-20 22:09    YES        NO          NO       YES
SYS        AUTO-CAPTURE                     30-JUL-20 02:21    30-JUL-20 02:41                       30-JUL-20 02:41    YES        NO          NO       YES
SYS        AUTO-CAPTURE                     07-AUG-20 18:33    07-AUG-20 19:16                       07-AUG-20 19:16    YES        NO          NO       YES
SYS        AUTO-CAPTURE                     13-AUG-20 22:52    14-AUG-20 22:10                       14-AUG-20 22:10    YES        NO          NO       YES
SYS        AUTO-CAPTURE                     14-AUG-20 05:16    14-AUG-20 22:10                       14-AUG-20 22:10    YES        NO          NO       YES
SYS        AUTO-CAPTURE                     14-AUG-20 15:42    14-AUG-20 22:10                       14-AUG-20 22:10    YES        NO          NO       YES
SYS        AUTO-CAPTURE                     18-AUG-20 23:22    19-AUG-20 22:11                       19-AUG-20 22:11    YES        NO          NO       YES
SYS        AUTO-CAPTURE                     27-AUG-20 00:07    27-AUG-20 22:11                       27-AUG-20 22:11    YES        NO          NO       YES
Ok, there was a huge SQL Plan Management activity here. All starts on 30-MAY-20 and this is when my ATP database has been upgraded to 19c. 19c comes with two new features. First new feature is “Automatic SQL tuning set” which gathers a lot of statements in SYS_AUTO_STS as we have seen above. The other feature, “Automatic SQL Plan Management”, or “Automatic Resolution of Plan Regressions” look into AWR for resource intensive statements with several execution plans. Then it create SQL Plan BAselines for them, loading all alternative plans that are found in AWR, SQL Tuning Sets, and Cursor Cache. And this is why I have EVOLVE-LOAD-FROM-AWR and EVOLVE-LOAD-FROM-CURSOR-CACHE loaded on 30-MAY-20 11:50
This feature is explained by Nigel Bayliss blog post.
So, here are the settings in the Autonomous Database, ALTERNATE_PLAN_BASELINE=AUTO which enables the Auto SPM and ALTERNATE_PLAN_SOURCE=AUTO which means: AUTOMATIC_WORKLOAD_REPOSITORY+CURSOR_CACHE+SQL_TUNING_SET
DEMO@atp1_tp> select parameter_name, parameter_value from   dba_advisor_parameters
              where  task_name = 'SYS_AUTO_SPM_EVOLVE_TASK' and parameter_value  'UNUSED' order by 1;

             PARAMETER_NAME    PARAMETER_VALUE
___________________________ __________________
ACCEPT_PLANS                TRUE
ALTERNATE_PLAN_BASELINE     AUTO
ALTERNATE_PLAN_LIMIT        UNLIMITED
ALTERNATE_PLAN_SOURCE       AUTO
DAYS_TO_EXPIRE              UNLIMITED
DEFAULT_EXECUTION_TYPE      SPM EVOLVE
EXECUTION_DAYS_TO_EXPIRE    30
JOURNALING                  INFORMATION
MODE                        COMPREHENSIVE
TARGET_OBJECTS              1
TIME_LIMIT                  3600
_SPM_VERIFY                 TRUE
This query (and explanations) are from Mike Dietrich blog post which you should read.
So, I can see many plans for this query, some accepted and some not. The Auto Evolve advisor task should help to see which plan is ok or not but it seems that it cannot for this statement:
SELECT DBMS_SPM.report_auto_evolve_task FROM   dual;
...

---------------------------------------------------------------------------------------------
 Object ID          : 848087
 Test Plan Name     : SQL_PLAN_gf2c99a3zrzsgd6c09b5e
 Base Plan Name     : Cost-based plan
 SQL Handle         : SQL_f709894a87fbff0f
 Parsing Schema     : SYS
 Test Plan Creator  : SYS
 SQL Text           : SELECT /*+dynamic_sampling(11) NO_XML_QUERY_REWRITE */
...

FINDINGS SECTION
---------------------------------------------------------------------------------------------

Findings (1):
-----------------------------
 1. This plan was skipped because either the database is not fully open or the
    SQL statement is ineligible for SQL Plan Management.
I dropped all those SQL Plan Baselines:
set serveroutput on
exec dbms_output.put_line ( DBMS_SPM.DROP_SQL_PLAN_BASELINE(sql_handle => 'SQL_f709894a87fbff0f') );
but the query is still long. The problem is not about the Auto SPM job which just tries to find a solution.
It seems that the Auto Index query spends time on this HASH GROUP BY because of the following:
     SELECT
...
     FROM
     (SELECT SQL_ID, PLAN_HASH_VALUE,MIN(ELAPSED_TIME) ELAPSED_TIME,MIN(EXECUTIONS) EXECUTIONS,MIN(OPTIMIZER_ENV) CE,
             MAX(EXISTSNODE(XMLTYPE(OTHER_XML),
                            '/other_xml/info[@type = "has_user_tab"]')) USER_TAB
       FROM
...
     GROUP BY SQL_ID, PLAN_HASH_VALUE
     )
     WHERE USER_TAB > 0
This is the AI job looking at many statements, with their OTHER_XML plan information and doing a group by on that. There are probably no optimal plans for this query.
Them why do I have so many statements in the auto-captured SQL Tuning Set? An application should have a limited set of statements. In OLTP, with many executions for different values, we should use bind variables to limit the set of statements. In DWH, ad-hoc queries should have so many executions.
When looking at the statements not using bind variables, the FORCE_MATCHING_SIGNATURE is the right dimension on which to aggregates them as there are too many SQL_ID:
DEMO@atp1_tp> select force_matching_signature from dba_sqlset_statements group by force_matching_signature order by count(*) desc fetch first 2 rows only;

     FORCE_MATCHING_SIGNATURE
_____________________________
    7,756,258,419,218,828,704
   15,893,216,616,221,909,352

DEMO@atp1_tp> select sql_text from dba_sqlset_statements where force_matching_signature=15893216616221909352 fetch first 3 rows only;
                                                     SQL_TEXT
_____________________________________________________________
select FLAGS from SYS_FBA_TRACKEDTABLES where OBJ# = 50867
select FLAGS from SYS_FBA_TRACKEDTABLES where OBJ# = 51039
select FLAGS from SYS_FBA_TRACKEDTABLES where OBJ# = 51048

DEMO@atp1_tp> select sql_text from dba_sqlset_statements where force_matching_signature=7756258419218828704 fetch first 3 rows only;
                                                                                   SQL_TEXT
___________________________________________________________________________________________
select count(FA#) from SYS_FBA_TRACKEDTABLES where OBJ# = 51039 and bitand(FLAGS, 128)=0
select count(FA#) from SYS_FBA_TRACKEDTABLES where OBJ# = 51049 and bitand(FLAGS, 128)=0
select count(FA#) from SYS_FBA_TRACKEDTABLES where OBJ# = 51047 and bitand(FLAGS, 128)=0
I have two FORCE_MATCHING_SIGNATURE that have the most rows in DBA_SQLSET_STATEMENTS and looking at a sample of them confirms that they don’t use bind variables. They are oracle internal queries and because I have the FORCE_MATCHING_SIGNATURE I put it in a google search in order to see if others already have seen the issue (Oracle Support notes are also indexed by Google).
First result is a Connor McDonald blog post from 2016, taking this example to show how to hunt for SQL which should use bind variables:
https://connor-mcdonald.com/2016/05/30/sql-statements-using-literals/
There is also a hit on My Oracle Support for those queries:
5931756 QUERIES AGAINST SYS_FBA_TRACKEDTABLES DON’T USE BIND VARIABLES which is supposed to be fixed in 19c but obviously it is not. When I look at the patch I see “where OBJ# = :1” in ktfa.o
$ strings 15931756/files/lib/libserver18.a/ktfa.o | grep "SYS_FBA_TRACKEDTABLES where OBJ# = "
select count(FA#) from SYS_FBA_TRACKEDTABLES where OBJ# = :1 and bitand(FLAGS, :2)=0
select count(FA#) from SYS_FBA_TRACKEDTABLES where OBJ# = :1
select FLAGS from SYS_FBA_TRACKEDTABLES where OBJ# = :1
This uses bind variable.
But I checked in 19.6 and 20.3:
[oracle@cloud libserver]$ strings /u01/app/oracle/product/20.0.0/dbhome_1/bin/oracle | grep "SYS_FBA_TRACKEDTABLES where OBJ# = "
select count(FA#) from SYS_FBA_TRACKEDTABLES where OBJ# = %d and bitand(FLAGS, %d)=0
select count(FA#) from SYS_FBA_TRACKEDTABLES where OBJ# = %d
select FLAGS from SYS_FBA_TRACKEDTABLES where OBJ# = %d
This is string substitution. Not bind variable.
Ok, as usual, I went too far from my initial goal which was just sharing some screenshots about looking at Performance Hub. With the autonomous database we don’t have all tools we are used to. On a self-managed database I would have tkprof’ed this job that runs every 15 minutes. Different tools but still possible. In this example I drilled down the problematic query execution plan, found that a system table was too large, got the bug number that should be fixed and verified that it wasn’t.
If you want to drill down by yourself, I’m sharing one AWR report easy to download from the Performance Hub:
https://www.dropbox.com/s/vp8ndas3pcqjfuw/troubleshooting-autonomous-database-AWRReport.html
and PerfHub report gathered with dbms_perf.report_perfhub: https://www.dropbox.com/s/yup5m7ihlduqgbn/troubleshooting-autonomous-database-perfhub.html
Comments and questions welcome. If you are interested in an Oracle Performance Workshop tuning, I can do it in our office, customer premises or remotely (Teams, Teamviewer, or any tool you want). Just request it on: https://www.dbi-services.com/trainings/oracle-performance-tuning-training/#onsite. We can deliver a 3 days workshop on the optimizer concepts and hands-on lab to learn the troubleshooting method and tools. Or we can do some coaching looking at your environment on a shared screen: your database, your tools.
L’article Troubleshooting performance on Autonomous Database est apparu en premier sur dbi Blog.


 Hmmm, why ?


 to
to  and at the end to
 .
.


 . But the tool did not stop, it recovers more and more files and my hope was growing, to get both files back. The first file was back with the original name. For the second one, it was not that clear what happened. The tool was still running and recovers file after file after file and put all in the subdirectories MAGIC-2.
 Hmmm, why ?


 (@FranckPachot)