Quantcast
Channel: Archives des Troubleshooting - dbi Blog
↧

What to do in case all active Documentum jobs are no more running ?

$
0
0

The application support informed me that their jobs are not running anymore. When I started the analysis, I found that all activated jobs did not start for a few weeks.

First of all, I decided to work on a specific job which is not one from application team but where I know that I can start it several times without impacting the business.
Do you know which one? dm_ContentWarning

I checked the job attributes like start_date, expiration_date, is_inactive, target_server (as we have several Content Server to cover the high availability), a_last_invocation, a_next_invocation and of course the a_current_status.
Once this first check was done, with the DA I started the job (selected run now and saved the job).

  object_name                : dm_ContentWarning
  start_date                 : 5/30/2017 20:00:00
  expiration_date            : 5/30/2025 20:00:00
  max_iterations             : 0
  run_interval               : 1
  run_mode                   : 3
  is_inactive                : F
  inactivate_after_failure   : F
  target_server              : Docbase1.Docbase1@vmcs1.dbi-services.com
  a_last_invocation          : 9/20/2018 19:05:29
  a_last_completion          : 9/20/2018 19:07:00
  a_current_status           : ContentWarning Tool Completed at
                        9/20/2018 19:06:50.  Total duration was
                        1 minutes.
  a_next_invocation          : 9/21/2018 19:05:00

Few minutes later, I checked again the result and the different attributes, not all attributes like before but only a_last_completion and a_next_invocation and of course the content of the job log file. The job ran as expected when I forced the job to run.

  a_last_completion          : 10/31/2018 10:41:25
  a_current_status           : ContentWarning Tool Completed at
                        10/31/2018 10:41:14.  Total duration
                        was 2 minutes.
  a_next_invocation          : 10/31/2018 19:05:00
[dmadmin@vmcs1 agentexec]$ more job_0801234380000359
Wed Oct 31 10:39:54 2018 [INFORMATION] [LAUNCHER 12071] Detected while preparing job dm_ContentWarning for execution: Agent Exec
connected to server Docbase1:  [DM_SESSION_I_SESSION_START]info:  "Session 01012343807badd5 started for user dmadmin."
...
...

Ok the job ran and the a_next_invocation was set accordingly to run_interval and run_mode in our case once a day. (I thought), I found the reason of the issue: the repository was stopped for a few days and therefore, when restarted, the a_next_invocation date was in the past (a_next_invocation: 9/21/2018 19:05:00). So I decided to see the result the day after once the job ran based on the defined schedule (a_next_invocation: 10/31/2018 19:05:00).

The next day… the job did not run. Strange!
I decided to think a bit deeper ;-). Do something else to go a step further and set the a_next_invocation date to run the job in 5 minutes.

update dm_job objects set a_next_invocation = date('01.11.2018 11:53:00','dd.mm.yyyy hh:mi:ss') where object_name = 'dm_ContentWarning';
1

select r_object_id, object_name, a_next_invocation from dm_job where object_name = 'dm_ContentWarning';
0801234380000359	dm_ContentWarning	11/01/2018 11:53:00

Result, the job did not start. šŸ™ Hmmm, why ?

Before continuing to work on the job, I did some other checks, like analyzing the log files, repository, agent_exec, sysadmin etc.
I found that the DB was down a few days before and decided to restart the repository, set the a_next_invocation again but unfortunately this did not help.

To be sure it’s not related to the full installation, I ran, successfully, a distributed job (the dm_contentWarningvmcs2_Docbase1) on the second Content Server. This meant the issue is only located on my first Content Server.

Searching in the OpenText knowledge base (KB9264366, KB8716186 and KB6327280), none of them gave me the solution.

I knew, even if I did not used often it in my last 20 years in the Documentum world, that we can trace the agent_exec so let’s see this point:

  1. add for the dm_agent_method the parameter -trace_level 1
  2. reinit the server
  3. kill the dm_agent_exec process related to Docbase1, the process will be started automatically after few minutes.
[dmadmin@vmcs1 agentexec]$ ps -ef | grep agent | grep Docbase1
dmadmin  27312 26944  0 Oct31 ?        00:00:49 ./dm_agent_exec -enable_ha_setup 1 -docbase_name dmadmin  27312 26944  0 Oct31 ?        00:00:49 ./dm_agent_exec -enable_ha_setup 1 -docbase_name Docbase1.Docbase1 -docbase_owner dmadmin -sleep_duration 0
[dmadmin@vmcs1 agentexec]$ kill -9 27312
[dmadmin@vmcs1 agentexec]$ ps -ef | grep agent | grep Docbase1
[dmadmin@vmcs1 agentexec]$
[dmadmin@vmcs1 agentexec]$ ps -ef | grep agent | grep Docbase1
dmadmin  15440 26944 57 07:48 ?        00:00:06 ./dm_agent_exec -enable_ha_setup 1 -trace_level 1 -docbase_name Docbase1.Docbase1 -docbase_owner dmadmin -sleep_duration 0
[dmadmin@vmcs1 agentexec]$

I changed again the a_next_invocation and check the agent_exec log file where the executed queries have been recorded.
Two recorded queries seemed to be important:

SELECT count(r_object_id) as cnt FROM dm_job WHERE ( (run_now = 1) OR ((is_inactive = 0) AND ( ( a_next_invocation <= DATE('now') AND a_next_invocation IS NOT NULLDATE ) OR ( a_next_continuation  DATE('now')) OR (expiration_date IS NULLDATE)) AND ((max_iterations = 0) OR (a_iterations < max_iterations))) ) AND (i_is_reference = 0 OR i_is_reference is NULL) AND (i_is_replica = 0 OR i_is_replica is NULL) AND UPPER(target_server) = 'DOCBASE1.DOCBASE1@VMCS1.DBI-SERVICES-COM'

SELECT ALL r_object_id, a_next_invocation FROM dm_job WHERE ( (run_now = 1) OR ((is_inactive = 0) AND ( ( a_next_invocation <= DATE('now') AND a_next_invocation IS NOT NULLDATE ) OR ( a_next_continuation  DATE('now')) OR (expiration_date IS NULLDATE)) AND ((max_iterations = 0) OR (a_iterations < max_iterations))) ) AND (i_is_reference = 0 OR i_is_reference is NULL) AND (i_is_replica = 0 OR i_is_replica is NULL) AND UPPER(target_server) = 'DOCBASE1.DOCBASE1@VMCS1.DBI-SERVICES-COM' ORDER BY run_now DESC, a_next_invocation, r_object_id ENABLE (RETURN_TOP 3 )

I executed the second query and it found three jobs (RETURN_TOP 3) which are from the application team. As the three selected jobs have an old a_next_invocation value, they will never run and will always be selected when the job is executed and unfortunately this means my dm_ContentWarning job will never be selected for automatic execution.

I informed the application team that I will keep only one job active (dm_ContentWarning) to see if the job will run. And guess what, it ran … YES!

Okay, now we have the solution:

  • reactivate all previously deactivated job
  • set the a_next_invocation to a future date

And do not forget to deactivate the trace for the dm_agent_exec.

L’article What to do in case all active Documentum jobs are no more running ? est apparu en premier sur dbi Blog.

↧

SQL Server Tips: Orphan database user but not so orphan…

$
0
0

Beginning of this year, it is good to clean up orphan users in SQL Server databases.
Even if this practice must be done regularly throughout the year of course. šŸ˜‰

During my cleaning day, a new case appears that I never had before and enjoy to share it with you.
To find orphan database-users, I use this query:

SELECT *FROM sys.database_principals a
LEFT OUTER JOIN sys.server_principals b ON a.sid = b.sid
WHERE b.sid IS NULL
AND a.type In ('U', 'G')
AND a.principal_id > 4

This query for orphan users is focussed on Windows Logins or Groups and not SQL Logins.


After running the query, I find one user (that I renamed dbi_user to anonymize my blog).
I try to drop the user….


I’m not lucky! As you can see in the screenshot above, I have an error message:
Msg 15136, Level 16, State 1, Line 4
The database principal is set as the execution context of one or more procedures, functions, or event notifications and cannot be dropped

What does this message means?
In my database, this user is used as execution context (EXECUTE AS) in stored procedures, functions or event notifications.
I need to find now, where this user is used.
For that, I will use the DMV sys.sql_modules combined with sys.database_principals:

Select sqlm.object_id, sqlm.definition, dp.principal_id,dp.name from sys.sql_modules sqlm join sys.database_principals dp on sqlm.execute_as_principal_id=dp.principal_id

In my case, I find one stored procedure linked to my user.
To have a good answer for my query, I add a clause where to eliminate these cases:

  • execute_as_principal_id= NULL –> EXECUTE AS CALLER
  • execute_as_principal_id=-2 –> execute as owner
  • execute_as_principal_id=1 –> execute as dbo
  • execute_as_principal_id=8 –> execute as AllSchemaOwner in SSISDB if needed

My new query will be this one:

Select sqlm.object_id, sqlm.definition, dp.principal_id,dp.name from sys.sql_modules sqlm join sys.database_principals dp on sqlm.execute_as_principal_id=dp.principal_id where sqlm.execute_as_principal_id is not null and sqlm.execute_as_principal_id!=-2 and sqlm.execute_as_principal_id!=1


And now, I have only the stored procedure with the execution context of my user dbi_user.
After that, I copy the value of the definition column to see the code


As you can see my user dbi_user is not explicitly specified in the Execute as.
The stored procedure uses execute as self and if I search the user name in the definition column like this query below, I will never find the user:

Select sqlm.object_id, sqlm.definition, dp.principal_id,dp.name from sys.sql_modules sqlm join sys.database_principals dp
on sqlm.execute_as_principal_id=dp.principal_id where sqlm.definition like '%dbi_user%'

You can also use the store procedure sp_MSforeachdb to find all ā€œspecial usersā€ used in modules:

exec sp_MSforeachdb N'select ''?'',sqlm.object_id, sqlm.definition, dp.principal_id,dp.name from [?].sys.sql_modules sqlm join [?].sys.database_principals dp on sqlm.execute_as_principal_id=dp.principal_id where execute_as_principal_id is not null and execute_as_principal_id!=-2 and execute_as_principal_id!=1'

What can I do now?
The only thing to do is to contact the owner of this SP and see with him what to do.
In the Microsoft documentation about Execute AS, you can read:
ā€œIf the user is orphaned (the associated login no longer exists), and the user was not created with WITHOUT LOGIN, EXECUTE AS will fail for the user.ā€

This means that this Stored Procedure will fail if it is used…

I hope this blog can help you šŸ˜Ž

Ā 

L’article SQL Server Tips: Orphan database user but not so orphan… est apparu en premier sur dbi Blog.

↧
↧

SQL Server Tips: Path of the default trace file is null

$
0
0

In addition of my precedent blog about this subject ā€œSQL Server Tips: Default trace enabled but no file is activeā€¦ā€, I add a new case where the default path of the trace file was empty.

The first step was to verify if the default trace is enabled with the command:

SELECT * FROM sys.configurations WHERE name=’default trace enable’

It is enabled, then I check the current running trace with the view sys.traces

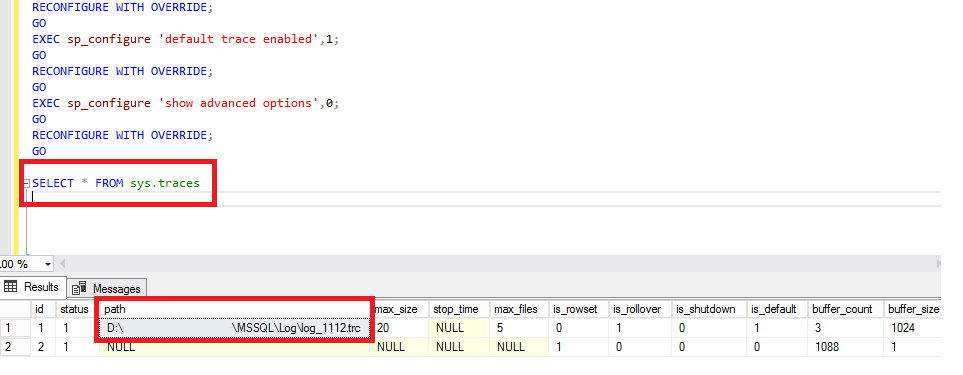
SELECT * FROM sys.traces


As you can see, this time I have a trace but with a null in the Path for the trace file…

To correct this issue, the only way is to stop and reactive the trace in the configuration:

EXEC sp_configure 'show advanced options',1;
GO
RECONFIGURE WITH OVERRIDE;
GO
EXEC sp_configure 'default trace enabled',0;
GO
RECONFIGURE WITH OVERRIDE;
GO
EXEC sp_configure 'default trace enabled',1;
GO
RECONFIGURE WITH OVERRIDE;
GO
EXEC sp_configure 'show advanced options',0;
GO
RECONFIGURE WITH OVERRIDE;
GO

Et voila, I have a trace file now…

L’article SQL Server Tips: Path of the default trace file is null est apparu en premier sur dbi Blog.

↧

Troubleshooting performance on Autonomous Database

$
0
0

By Franck Pachot

.

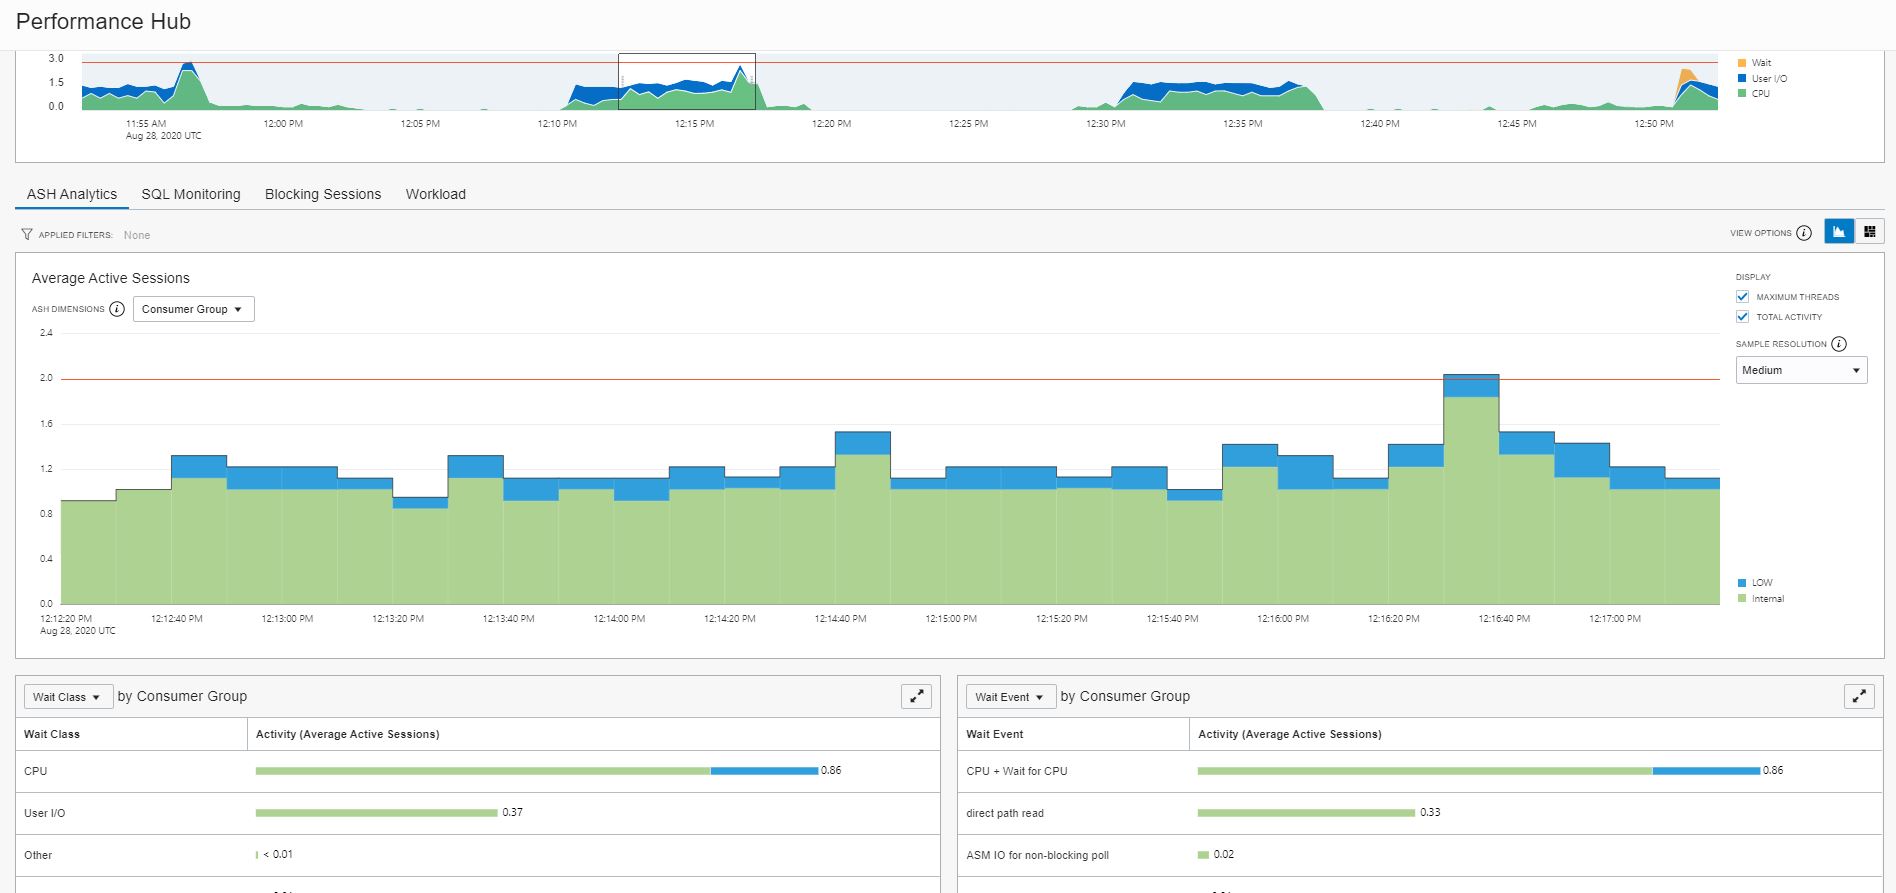
On my Oracle Cloud Free Tier Autonomous Transaction Processing service, a database that can be used for free with no time limit, I have seen this strange activity. As I’m running nothing scheduled, I was surprised by this pattern and looked at it by curiosity. And I got the idea to take some screenshot to show you how I look at those things. The easiest performance tool available in the Autonomous Database is the Performance Hub which shows the activity though time with detail on multiple dimensions for drill-down analysis. This is based on ASH of course.

In the upper pane, I focus on the part with homogenous activity because I may views the content without the timeline and then want to compare the activity metric (Average Active Session) with the peak I observed. Without this, I may start to look to something that is not significant and waste my time. Here, where the activity is about 1 active session, I want to drill-down on dimensions that account for around 0.8 active sessions to be sure to address 80% of the surprising activity. If the part selected includes some idle time around, I would not be able to do this easily.

The second pane let me drill-down either on 3 dimensions in a load map (we will see that later), or one main dimension with the time axis (in this screenshot the dimension is ā€œConsumer Groupā€) with two other dimensions below displayed without the time detail, here ā€œWait Classā€ and ā€œWait Eventā€. This is where I want to compare the activity (0.86 average active session on CPU) to the load I’m looking at, as I don’t have the time to see peaks and idle periods.

  • I see ā€œInternalā€ for all ā€œSession Attributesā€ ASH dimensions, like ā€œConsumer Groupā€, ā€œModuleā€, ā€œActionā€, ā€œClientā€, ā€œClient Host Portā€
  • About ā€œSession Identifiersā€ ASH dimensions, I still see ā€œinternalā€ for ā€œUser Sessionā€, ā€œUser Nameā€ and ā€œProgramā€.
  • ā€œParallel Processā€ shows ā€œSerialā€ and ā€œSession Typeā€ shows ā€œForegroundā€ which doesn’t give me more information

I have more information from ā€œResource Consumptionā€:

  • ASH Dimension ā€œWait Classā€: mostly ā€œCPUā€ and some ā€œUser I/Oā€
  • ASH Dimension ā€œWait Eventā€: the ā€œUser I/Oā€ is ā€œdirect path read tempā€

I’ll dig into those details later. There’s no direct detail for the CPU consumption. I’ll look at logical reads of course, and SQL Plan but I cannot directly match the CPU time with that. Especially from Average Active Session where I don’t have the CPU time – I have only samples there. It may be easier with ā€œUser I/Oā€ because they should show up in other dimensions.

There are no ā€œBlocking Sessionā€ but the ASH Dimension ā€œObjectā€ gives interesting information:

  • ASH Dimension ā€œObjectā€: SYS.SYS_LOB0000009134C00039$$ and SYS.SYS_LOB0000011038C00004$$ (LOB)

I don’t know an easy way to copy/paste from the Performance Hub so I have generated an AWR report and found them in the Top DB Objects section:

Object ID % Activity Event % Event Object Name (Type) Tablespace Container Name
9135 24.11 direct path read 24.11 SYS.SYS_LOB0000009134C00039$$ (LOB) SYSAUX SUULFLFCSYX91Z0_ATP1
11039 10.64 direct path read 10.64 SYS.SYS_LOB0000011038C00004$$ (LOB) SYSAUX SUULFLFCSYX91Z0_ATP1

Ā 

That’s the beauty of ASH. In addition, to show you the load per multiple dimensions, it links all dimensions. Here, without guessing, I know that those objects are responsible for the ā€œdirect path read tempā€ I have seen above.

Let me insist on the numbers. I mentioned that I selected, in the upper chart, a homogeneous activity time window in order to compare the activity number with and without the time axis. My total activity during this time window is a little bit over 1 session active (on average, AAS – Average Active Session). I can see this on the time chart y-axis. And I confirm it if I sum-up the aggregations on other dimensions. Like above CPU + USER I/O was 0.86 + 0.37 =1.23 when the selected part was around 1.25 active sessions. Here when looking at ā€œObjectā€ dimension, I see around 0.5 sessions on SYS_LOB0000011038C00004$$ (green) during one minute, then around 0.3 sessions on SYS_LOB0000009134C00039$$ (blue) for 5 minutes and no activity on objects during 1 minute. That matches approximately the 0.37 AAS on User I/O. From the AWR report this is displayed as ā€œ% Eventā€ and 24.11 + 10.64 = 34.75% which is roughly the ratio of those 0.37 to 1.25 we had with Average Active Sessions. When looking at sampling activity details, it is important to keep in mind the weight of each component we look at.

Let’s get more detail about those objects, from SQL Developer Web, or any connection:


DEMO@atp1_tp> select owner,object_name,object_type,oracle_maintained from dba_objects 
where owner='SYS' and object_name in ('SYS_LOB0000009134C00039$$','SYS_LOB0000011038C00004$$');

   OWNER                  OBJECT_NAME    OBJECT_TYPE    ORACLE_MAINTAINED
________ ____________________________ ______________ ____________________
SYS      SYS_LOB0000009134C00039$$    LOB            Y
SYS      SYS_LOB0000011038C00004$$    LOB            Y

DEMO@atp1_tp> select owner,table_name,column_name,segment_name,tablespace_name from dba_lobs 
where owner='SYS' and segment_name in ('SYS_LOB0000009134C00039$$','SYS_LOB0000011038C00004$$');

   OWNER                TABLE_NAME    COLUMN_NAME                 SEGMENT_NAME    TABLESPACE_NAME
________ _________________________ ______________ ____________________________ __________________
SYS      WRI$_SQLSET_PLAN_LINES    OTHER_XML      SYS_LOB0000009134C00039$$    SYSAUX
SYS      WRH$_SQLTEXT              SQL_TEXT       SYS_LOB0000011038C00004$$    SYSAUX

Ok, that’s interesting information. It confirms why I see ā€˜internal’ everywhere: those are dictionary tables.

WRI$_SQLSET_PLAN_LINES is about SQL Tuning Sets and in 19c, especially with the Auto Index feature, the SQL statements are captured every 15 minutes and analyzed to find index candidates. A look at SQL Tuning Sets confirms this:


DEMO@atp1_tp> select sqlset_name,parsing_schema_name,count(*),dbms_xplan.format_number(sum(length(sql_text))),min(plan_timestamp)
from dba_sqlset_statements group by parsing_schema_name,sqlset_name order by count(*);


    SQLSET_NAME    PARSING_SCHEMA_NAME    COUNT(*)    DBMS_XPLAN.FORMAT_NUMBER(SUM(LENGTH(SQL_TEXT)))    MIN(PLAN_TIMESTAMP)
_______________ ______________________ ___________ __________________________________________________ ______________________
SYS_AUTO_STS    C##OMLIDM                        1 53                                                 30-APR-20
SYS_AUTO_STS    FLOWS_FILES                      1 103                                                18-JUL-20
SYS_AUTO_STS    DBSNMP                           6 646                                                26-MAY-20
SYS_AUTO_STS    XDB                              7 560                                                20-MAY-20
SYS_AUTO_STS    ORDS_PUBLIC_USER                 9 1989                                               30-APR-20
SYS_AUTO_STS    GUEST0001                       10 3656                                               20-MAY-20
SYS_AUTO_STS    CTXSYS                          12 1193                                               20-MAY-20
SYS_AUTO_STS    LBACSYS                         28 3273                                               30-APR-20
SYS_AUTO_STS    AUDSYS                          29 3146                                               26-MAY-20
SYS_AUTO_STS    ORDS_METADATA                   29 4204                                               20-MAY-20
SYS_AUTO_STS    C##ADP$SERVICE                  33 8886                                               11-AUG-20
SYS_AUTO_STS    MDSYS                           39 4964                                               20-MAY-20
SYS_AUTO_STS    DVSYS                           65 8935                                               30-APR-20
SYS_AUTO_STS    APEX_190200                    130 55465                                              30-APR-20
SYS_AUTO_STS    C##CLOUD$SERVICE               217 507K                                               30-APR-20
SYS_AUTO_STS    ADMIN                          245 205K                                               30-APR-20
SYS_AUTO_STS    DEMO                           628 320K                                               30-APR-20
SYS_AUTO_STS    APEX_200100                  2,218 590K                                               18-JUL-20
SYS_AUTO_STS    SYS                        106,690 338M                                               30-APR-20

All gathered by this SYS_AUTO_STS job. And the statements captured were parsed by SYS – a system job has hard work because of system statements, as I mentioned when seeing this for the first time:

With this drill-down from the ā€œObjectā€ dimension, I’ve already gone far enough to get an idea about the problem: an internal job is reading the huge SQL Tuning Sets that have been collected by the Auto STS job introduced in 19c (and used by Auto Index). But I’ll continue to look at all other ASH Dimensions. They can give me more detail or at least confirm my guesses. That’s the idea: you look at all the dimensions and once one gives you interesting information, you dig down to more details.

I look at ā€œPL/SQLā€ ASH dimension first because an application should call SQL from procedural code and not the opposite. And, as all this is internal, developed by Oracle, I expect they do it this way.

  • ASH Dimension ā€œPL/SQLā€: I see ā€˜7322,38’
  • ASH Dimension ā€œTop PL/SQLā€: I see ā€˜19038,5’

Again, I copy/paste to avoid typos and got them from the AWR report ā€œTop PL/SQL Proceduresā€ section:

PL/SQL Entry Subprogram % Activity PL/SQL Current Subprogram % Current Container Name
UNKNOWN_PLSQL_ID <19038, 5> 78.72 SQL 46.81 SUULFLFCSYX91Z0_ATP1
UNKNOWN_PLSQL_ID <7322, 38> 31.21 SUULFLFCSYX91Z0_ATP1
UNKNOWN_PLSQL_ID <13644, 332> 2.13 SQL 2.13 SUULFLFCSYX91Z0_ATP1
UNKNOWN_PLSQL_ID <30582, 1> 1.42 SQL 1.42 SUULFLFCSYX91Z0_ATP1

Side note on the number: activity was 0.35 AAS on top-level PL/SQL, 0.33 on current PL/SQL. 0.33 is included within 0.35 as a session active on a PL/SQL call. In AWR (where ā€œEntryā€ means ā€œtop-levelā€) you see them nested and including the SQL activity. This is why you see 78.72% here, it is SQL + PL/SQL executed under the top-level call. But actually, the procedure (7322,38) is 31.21% if the total AAS, which matches the 0.33 AAS.

By the way, I didn’t mention it before but this in AWR report is actually an ASH report that is included in the AWR html report.

Now trying to know which are those procedures. I think the ā€œUNKNOWNā€ comes from not finding it in the packages procedures:


DEMO@atp1_tp> select * from dba_procedures where (object_id,subprogram_id) in ( (7322,38) , (19038,5) );

no rows selected

but I find them from DBA_OBJECTS:


DEMO@atp1_tp> select owner,object_name,object_id,object_type,oracle_maintained,last_ddl_time from dba_objects where object_id in (7322,19038);

   OWNER           OBJECT_NAME    OBJECT_ID    OBJECT_TYPE    ORACLE_MAINTAINED    LAST_DDL_TIME
________ _____________________ ____________ ______________ ____________________ ________________
SYS      XMLTYPE                      7,322 TYPE           Y                    18-JUL-20
SYS      DBMS_AUTOTASK_PRVT          19,038 PACKAGE        Y                    22-MAY-20

and DBA_PROCEDURES:


DEMO@atp1_tp> select owner,object_name,procedure_name,object_id,subprogram_id from dba_procedures where object_id in(7322,19038);


   OWNER                   OBJECT_NAME    PROCEDURE_NAME    OBJECT_ID    SUBPROGRAM_ID
________ _____________________________ _________________ ____________ ________________
SYS      DBMS_RESULT_CACHE_INTERNAL    RELIES_ON               19,038                1
SYS      DBMS_RESULT_CACHE_INTERNAL                            19,038                0

All this doesn’t match šŸ™

My guess is that the top level PL/SQL object is DBMS_AUTOTASK_PRVT as I can see in the container it is running on, which is the one I’m connected to (an autonomous database is a pluggable database in the Oracle Cloud container database). It has the OBJECT_ID=19038 in my PDB. But the DBA_PROCEDURES is an extended data link and the OBJECT_ID of common objects are different in CDB$ROOT and PDBs. And OBJECT_ID=7322 is probably an identifier in CDB$ROOT, where active session monitoring runs. I cannot verify as I have only a local user. Because of this inconsistency, my drill-down on the PL/SQL dimension stops there.

The package calls some SQL and from browsing the AWR report I’ve seen in the time model that ā€œsql execute elapsed timeā€ is the major component:

Statistic Name Time (s) % of DB Time % of Total CPU Time
sql execute elapsed time 1,756.19 99.97
DB CPU 1,213.59 69.08 94.77
PL/SQL execution elapsed time 498.62 28.38

I’ll follow the hierarchy of this dimension – the most detailed will be the SQL Plan operation. But let’s start with ā€œSQL Opcodeā€

  • ASH Dimension ā€œTop Level Opcodeā€: mostly ā€œPL/SQL EXECUTEā€ which confirms that the SQL I’ll see is called by the PL/SQL.
  • ASH Dimension ā€œtop level SQL IDā€: mostly dkb7ts34ajsjy here. I’ll look at its details further.

From the AWR report, I see all statements with no distinction about the top level one, and there’s no spinning top to help you find what is running as a recursive call or the top-level one. It can be often guessed from the time and other statistics – here I have 3 queries taking almost the same database time:

Elapsed Time (s) Executions Elapsed Time per Exec (s) %Total %CPU %IO SQL Id SQL Module SQL Text
1,110.86 3 370.29 63.24 61.36 50.16 dkb7ts34ajsjy DBMS_SCHEDULER DECLARE job BINARY_INTEGER := …
1,110.85 3 370.28 63.24 61.36 50.16 f6j6vuum91fw8 DBMS_SCHEDULER begin /*KAPI:task_proc*/ dbms_…
1,087.12 3 362.37 61.88 61.65 49.93 0y288pk81u609 SYS_AI_MODULE SELECT /*+dynamic_sampling(11)…

SYS_AI_MODULE is the Auto Indexing feature


DEMO@atp1_tp> select distinct sql_id,sql_text from v$sql where sql_id in ('dkb7ts34ajsjy','f6j6vuum91fw8','0y288pk81u609');
dkb7ts34ajsjy    DECLARE job BINARY_INTEGER := :job;  next_date TIMESTAMP WITH TIME ZONE := :mydate;  broken BOOLEAN := FALSE;  job_name VARCHAR2(128) := :job_name;  job_subname VARCHAR2(128) := :job_subname;  job_owner VARCHAR2(128) := :job_owner;  job_start TIMESTAMP WITH TIME ZONE := :job_start;  job_scheduled_start TIMESTAMP WITH TIME ZONE := :job_scheduled_start;  window_start TIMESTAMP WITH TIME ZONE := :window_start;  window_end TIMESTAMP WITH TIME ZONE := :window_end;  chain_id VARCHAR2(14) :=  :chainid;  credential_owner VARCHAR2(128) := :credown;  credential_name  VARCHAR2(128) := :crednam;  destination_owner VARCHAR2(128) := :destown;  destination_name VARCHAR2(128) := :destnam;  job_dest_id varchar2(14) := :jdestid;  log_id number := :log_id;  BEGIN  begin dbms_autotask_prvt.run_autotask(3, 0);  end;  :mydate := next_date; IF broken THEN :b := 1; ELSE :b := 0; END IF; END;
f6j6vuum91fw8    begin /*KAPI:task_proc*/ dbms_auto_index_internal.task_proc(FALSE); end;                                                                                                                                                                                                                                                                                                                                                                                                                                                                                                                                                                                                                                                                                                                                                                                                                                                                                                                                                       
0y288pk81u609    SELECT /*+dynamic_sampling(11) NO_XML_QUERY_REWRITE */ SQL_ID, PLAN_HASH_VALUE, ELAPSED_TIME/EXECUTIONS ELAPSED_PER_EXEC, DBMS_AUTO_INDEX_INTERNAL.AUTO_INDEX_ALLOW(CE) SESSION_TYPE FROM (SELECT SQL_ID, PLAN_HASH_VALUE, MIN(ELAPSED_TIME) ELAPSED_TIME, MIN(EXECUTIONS) EXECUTIONS, MIN(OPTIMIZER_ENV) CE, MAX(EXISTSNODE(XMLTYPE(OTHER_XML), '/other_xml/info[@type = "has_user_tab"]')) USER_TAB FROM (SELECT F.NAME AS SQLSET_NAME, F.OWNER AS SQLSET_OWNER, SQLSET_ID, S.SQL_ID, T.SQL_TEXT, S.COMMAND_TYPE, P.PLAN_HASH_VALUE, SUBSTRB(S.MODULE, 1, (SELECT KSUMODLEN FROM X$MODACT_LENGTH)) MODULE, SUBSTRB(S.ACTION, 1, (SELECT KSUACTLEN FROM X$MODACT_LENGTH)) ACTION, C.ELAPSED_TIME, C.BUFFER_GETS, C.EXECUTIONS, C.END_OF_FETCH_COUNT, P.OPTIMIZER_ENV, L.OTHER_XML FROM WRI$_SQLSET_DEFINITIONS F, WRI$_SQLSET_STATEMENTS S, WRI$_SQLSET_PLANS P,WRI$_SQLSET_MASK M, WRH$_SQLTEXT T, WRI$_SQLSET_STATISTICS C, WRI$_SQLSET_PLAN_LINES L WHERE F.ID = S.SQLSET_ID AND S.ID = P.STMT_ID AND S.CON_DBID = P.CON_DBID AND P.

It looks like dbms_autotask_prvt.run_autotask calls dbms_auto_index_internal.task_proc that queries WRI$_SQLSET tables and this is where all the database time goes.

  • ASH Dimension ā€œSQL Opcodeā€: most of SELECT statements here
  • ASH Dimension ā€œSQL Force Matching Signatureā€ is interesting to group all statements that differ only by literals.
  • ASH Dimension ā€œSQL Plan Hash Valueā€, and the more detailed ā€œSQL Full Plan Hash Valueā€, are interesting to group all statements having the same execution plan shape, or exactly the same execution plan

  • ASH Dimension ā€œSQL IDā€ is the most interesting here to see which of this SELECT query is seen most of the time below this Top Level call, but unfortunately, I see ā€œinternal hereā€. Fortunately, the AWR report above did not hide this.
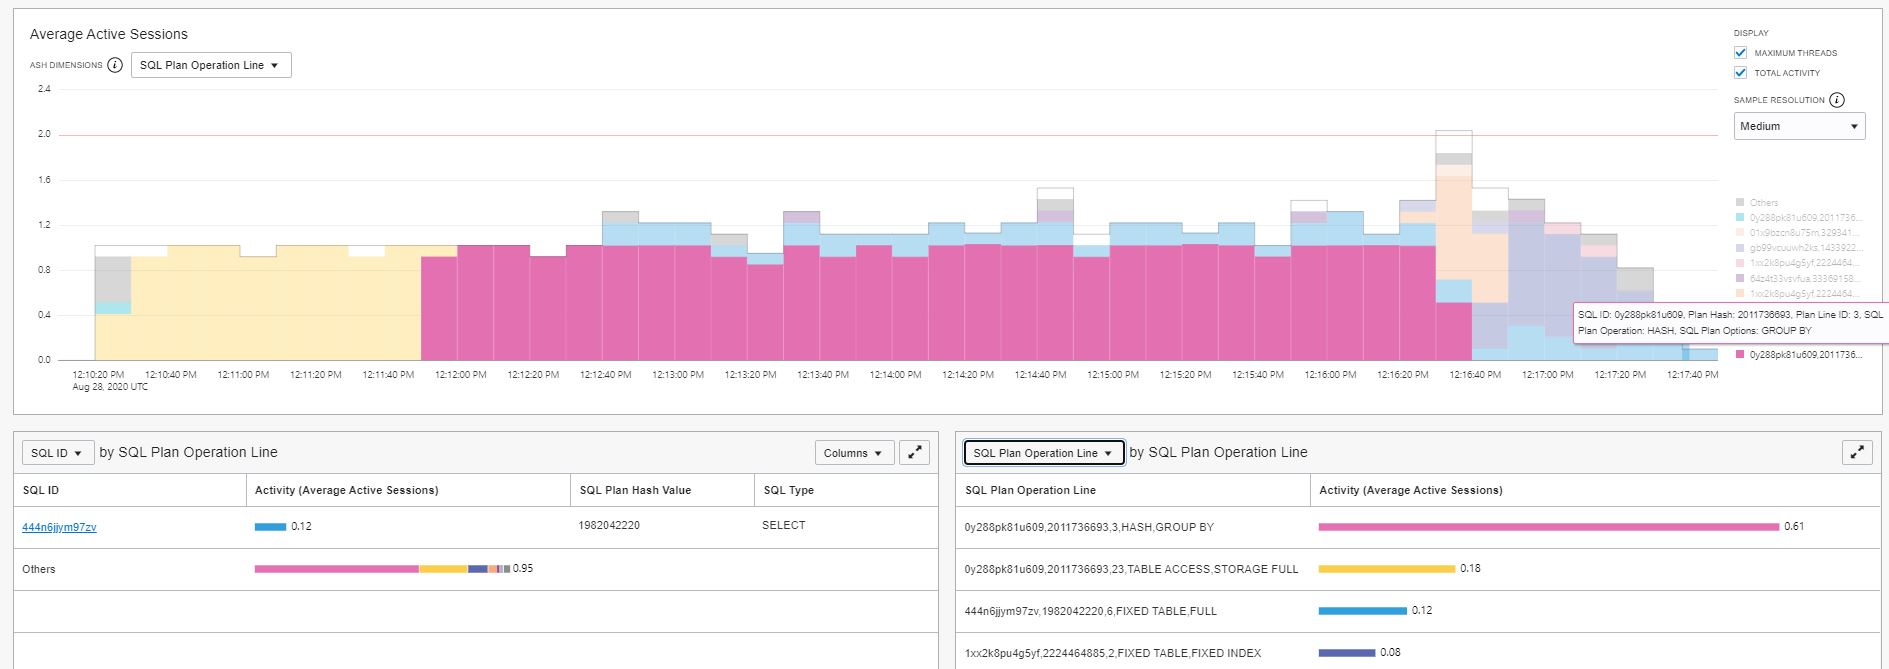
  • ASH Dimension ā€œSQL Plan Operationā€ shows me that within this query I’m spending time on HASH GROUP BY operation (which, is the workarea is large, does some ā€œdirect path read tempā€ as we encountered on the ā€œwait eventā€ dimension)
  • ASH Dimension ā€œSQL Plan Operation Lineā€ helps me to find this operation in the plan as in addition to the SQL_ID (the one that was hidden in the ā€œSQL_IDā€ dimension) I have the plan identification (plan hash value) and plan line number.

Again, I use the graphical Performance Hub to find where I need to drill down and find all details in the AWR report ā€œTop SQL with Top Eventsā€ section:

SQL ID Plan Hash Executions % Activity Event % Event Top Row Source % Row Source SQL Text
0y288pk81u609 2011736693 3 70.21 CPU + Wait for CPU 35.46 HASH – GROUP BY 28.37 SELECT /*+dynamic_sampling(11)…
direct path read 34.75 HASH – GROUP BY 24.11
444n6jjym97zv 1982042220 18 12.77 CPU + Wait for CPU 12.77 FIXED TABLE – FULL 12.77 SELECT /*+ unnest */ * FROM GV…
1xx2k8pu4g5yf 2224464885 2 5.67 CPU + Wait for CPU 5.67 FIXED TABLE – FIXED INDEX 2.84 SELECT /*+ first_rows(1) */ s…
3kqrku32p6sfn 3786872576 3 2.13 CPU + Wait for CPU 2.13 FIXED TABLE – FULL 2.13 MERGE /*+ OPT_PARAM(ā€˜_parallel…
64z4t33vsvfua 3336915854 2 1.42 CPU + Wait for CPU 1.42 FIXED TABLE – FIXED INDEX 0.71 WITH LAST_HOUR AS ( SELECT ROU…

I can see the full SQL Text in the AWR report and get the AWR statement report with dbms_workload_repository. I can also fetch the plan with DBMS_XPLAN.DISPLAY_AWR:


DEMO@atp1_tp> select * from dbms_xplan.display_awr('0y288pk81u609',2011736693,null,'+peeked_binds');


                                                                                                              PLAN_TABLE_OUTPUT
_______________________________________________________________________________________________________________________________
SQL_ID 0y288pk81u609
--------------------
SELECT /*+dynamic_sampling(11) NO_XML_QUERY_REWRITE */ SQL_ID,
PLAN_HASH_VALUE, ELAPSED_TIME/EXECUTIONS ELAPSED_PER_EXEC,
DBMS_AUTO_INDEX_INTERNAL.AUTO_INDEX_ALLOW(CE) SESSION_TYPE FROM (SELECT
SQL_ID, PLAN_HASH_VALUE, MIN(ELAPSED_TIME) ELAPSED_TIME,
MIN(EXECUTIONS) EXECUTIONS, MIN(OPTIMIZER_ENV) CE,
MAX(EXISTSNODE(XMLTYPE(OTHER_XML), '/other_xml/info[@type =
"has_user_tab"]')) USER_TAB FROM (SELECT F.NAME AS SQLSET_NAME, F.OWNER
AS SQLSET_OWNER, SQLSET_ID, S.SQL_ID, T.SQL_TEXT, S.COMMAND_TYPE,
P.PLAN_HASH_VALUE, SUBSTRB(S.MODULE, 1, (SELECT KSUMODLEN FROM
X$MODACT_LENGTH)) MODULE, SUBSTRB(S.ACTION, 1, (SELECT KSUACTLEN FROM
X$MODACT_LENGTH)) ACTION, C.ELAPSED_TIME, C.BUFFER_GETS, C.EXECUTIONS,
C.END_OF_FETCH_COUNT, P.OPTIMIZER_ENV, L.OTHER_XML FROM
WRI$_SQLSET_DEFINITIONS F, WRI$_SQLSET_STATEMENTS S, WRI$_SQLSET_PLANS
P,WRI$_SQLSET_MASK M, WRH$_SQLTEXT T, WRI$_SQLSET_STATISTICS C,
WRI$_SQLSET_PLAN_LINES L WHERE F.ID = S.SQLSET_ID AND S.ID = P.STMT_ID
AND S.CON_DBID = P.CON_DBID AND P.STMT_ID = C.STMT_ID AND
P.PLAN_HASH_VALUE = C.PLAN_HASH_VALUE AND P.CON_DBID = C.CON_DBID AND
P.STMT_ID = M.STMT_ID AND P.PLAN_HASH_VALUE = M.PLAN_HASH_VALUE AND
P.CON_DBID = M.CON_DBID AND S.SQL_ID = T.SQL_ID AND S.CON_DBID =
T.CON_DBID AND T.DBID = F.CON_DBID AND P.STMT_ID=L.STMT_ID AND
P.PLAN_HASH_VALUE = L.PLAN_HASH_VALUE AND P.CON_DBID = L.CON_DBID) S,
WRI$_ADV_OBJECTS OS WHERE SQLSET_OWNER = :B8 AND SQLSET_NAME = :B7 AND
(MODULE IS NULL OR (MODULE != :B6 AND MODULE != :B5 )) AND SQL_TEXT NOT
LIKE 'SELECT /* DS_SVC */%' AND SQL_TEXT NOT LIKE 'SELECT /*
OPT_DYN_SAMP */%' AND SQL_TEXT NOT LIKE '/*AUTO_INDEX:ddl*/%' AND
SQL_TEXT NOT LIKE '%/*+%dbms_stats%' AND COMMAND_TYPE NOT IN (9, 10,
11) AND PLAN_HASH_VALUE > 0 AND BUFFER_GETS > 0 AND EXECUTIONS > 0 AND
OTHER_XML IS NOT NULL AND OS.SQL_ID_VC (+)= S.SQL_ID AND OS.TYPE (+)=
:B4 AND DECODE(OS.TYPE(+), :B4 , TO_NUMBER(OS.ATTR2(+)), -1) =
S.PLAN_HASH_VALUE AND OS.TASK_ID (+)= :B3 AND OS.EXEC_NAME (+) IS NULL
AND (OS.SQL_ID_VC IS NULL OR TO_DATE(OS.ATTR18, :B2 )  0 ORDER BY
DBMS_AUTO_INDEX_INTERNAL.AUTO_INDEX_ALLOW(CE) DESC, ELAPSED_TIME DESC

Plan hash value: 2011736693

----------------------------------------------------------------------------------------------------------------------------
| Id  | Operation                                 | Name                           | Rows  | Bytes | Cost (%CPU)| Time     |
----------------------------------------------------------------------------------------------------------------------------
|   0 | SELECT STATEMENT                          |                                |       |       |   957 (100)|          |
|   1 |  SORT ORDER BY                            |                                |   180 |   152K|   957  (18)| 00:00:01 |
|   2 |   FILTER                                  |                                |       |       |            |          |
|   3 |    HASH GROUP BY                          |                                |   180 |   152K|   957  (18)| 00:00:01 |
|   4 |     NESTED LOOPS                          |                                |  3588 |  3030K|   955  (18)| 00:00:01 |
|   5 |      FILTER                               |                                |       |       |            |          |
|   6 |       HASH JOIN RIGHT OUTER               |                                |  3588 |  2964K|   955  (18)| 00:00:01 |
|   7 |        TABLE ACCESS BY INDEX ROWID BATCHED| WRI$_ADV_OBJECTS               |     1 |    61 |     4   (0)| 00:00:01 |
|   8 |         INDEX RANGE SCAN                  | WRI$_ADV_OBJECTS_IDX_02        |     1 |       |     3   (0)| 00:00:01 |
|   9 |        HASH JOIN                          |                                |  3588 |  2750K|   951  (18)| 00:00:01 |
|  10 |         TABLE ACCESS STORAGE FULL         | WRI$_SQLSET_PLAN_LINES         | 86623 |  2706K|   816  (19)| 00:00:01 |
|  11 |         HASH JOIN                         |                                |  3723 |  2737K|   134   (8)| 00:00:01 |
|  12 |          TABLE ACCESS STORAGE FULL        | WRI$_SQLSET_STATISTICS         | 89272 |  2789K|    21  (10)| 00:00:01 |
|  13 |          HASH JOIN                        |                                |  3744 |  2636K|   112   (7)| 00:00:01 |
|  14 |           JOIN FILTER CREATE              | :BF0000                        |  2395 |   736K|    39  (13)| 00:00:01 |
|  15 |            HASH JOIN                      |                                |  2395 |   736K|    39  (13)| 00:00:01 |
|  16 |             TABLE ACCESS STORAGE FULL     | WRI$_SQLSET_STATEMENTS         |  3002 |   137K|    13  (24)| 00:00:01 |
|  17 |              FIXED TABLE FULL             | X$MODACT_LENGTH                |     1 |     5 |     0   (0)|          |
|  18 |              FIXED TABLE FULL             | X$MODACT_LENGTH                |     1 |     5 |     0   (0)|          |
|  19 |              FIXED TABLE FULL             | X$MODACT_LENGTH                |     1 |     5 |     0   (0)|          |
|  20 |             NESTED LOOPS                  |                                |  1539 |   402K|    25   (4)| 00:00:01 |
|  21 |              TABLE ACCESS BY INDEX ROWID  | WRI$_SQLSET_DEFINITIONS        |     1 |    27 |     1   (0)| 00:00:01 |
|  22 |               INDEX UNIQUE SCAN           | WRI$_SQLSET_DEFINITIONS_IDX_01 |     1 |       |     0   (0)|          |
|  23 |              TABLE ACCESS STORAGE FULL    | WRH$_SQLTEXT                   |  1539 |   362K|    24   (5)| 00:00:01 |
|  24 |           JOIN FILTER USE                 | :BF0000                        | 89772 |    34M|    73   (3)| 00:00:01 |
|  25 |            TABLE ACCESS STORAGE FULL      | WRI$_SQLSET_PLANS              | 89772 |    34M|    73   (3)| 00:00:01 |
|  26 |      INDEX UNIQUE SCAN                    | WRI$_SQLSET_MASK_PK            |     1 |    19 |     0   (0)|          |
----------------------------------------------------------------------------------------------------------------------------

Hint Report (identified by operation id / Query Block Name / Object Alias):
Total hints for statement: 7 (U - Unused (7))
---------------------------------------------------------------------------

   0 -  SEL$5
         U -  MERGE(@"SEL$5" >"SEL$4") / duplicate hint
         U -  MERGE(@"SEL$5" >"SEL$4") / duplicate hint

   1 -  SEL$5C160134
         U -  dynamic_sampling(11) / rejected by IGNORE_OPTIM_EMBEDDED_HINTS

  17 -  SEL$7286615E
         U -  PUSH_SUBQ(@"SEL$7286615E") / duplicate hint
         U -  PUSH_SUBQ(@"SEL$7286615E") / duplicate hint

  17 -  SEL$7286615E / X$MODACT_LENGTH@SEL$5
         U -  FULL(@"SEL$7286615E" "X$MODACT_LENGTH"@"SEL$5") / duplicate hint
         U -  FULL(@"SEL$7286615E" "X$MODACT_LENGTH"@"SEL$5") / duplicate hint

Peeked Binds (identified by position):
--------------------------------------

   1 - :B8 (VARCHAR2(30), CSID=873): 'SYS'
   2 - :B7 (VARCHAR2(30), CSID=873): 'SYS_AUTO_STS'
   5 - :B4 (NUMBER): 7
   7 - :B3 (NUMBER): 15

Note
-----
   - SQL plan baseline SQL_PLAN_gf2c99a3zrzsge1b441a5 used for this statement

I can confirm what I’ve seen about HASH GROUP BY on line ID=3
I forgot to mention that SQL Monitor is not available for this query probably because it is disabled for internal queries. Anyway, the most interesting here is that the plan comes from SQL Plan Management

Here is more information about this SQL Plan Baseline:


DEMO@atp1_tp> select * from dbms_xplan.display_sql_plan_baseline('','SQL_PLAN_gf2c99a3zrzsge1b441a5');
                                                                                                                  ...
--------------------------------------------------------------------------------
SQL handle: SQL_f709894a87fbff0f
SQL text: SELECT /*+dynamic_sampling(11) NO_XML_QUERY_REWRITE */ SQL_ID,
          PLAN_HASH_VALUE, ELAPSED_TIME/EXECUTIONS ELAPSED_PER_EXEC,
...
--------------------------------------------------------------------------------
Plan name: SQL_PLAN_gf2c99a3zrzsge1b441a5         Plan id: 3786686885
Enabled: YES     Fixed: NO      Accepted: YES     Origin: AUTO-CAPTURE
Plan rows: From dictionary
--------------------------------------------------------------------------------
...

This shows only one plan, but I want to see all plans for this statement.


DEMO@atp1_tp> select 
CREATOR,ORIGIN,CREATED,LAST_MODIFIED,LAST_EXECUTED,LAST_VERIFIED,ENABLED,ACCEPTED,FIXED,REPRODUCED
from dba_sql_plan_baselines where sql_handle='SQL_f709894a87fbff0f' order by created;


   CREATOR                           ORIGIN            CREATED      LAST_MODIFIED      LAST_EXECUTED      LAST_VERIFIED    ENABLED    ACCEPTED    FIXED    REPRODUCED
__________ ________________________________ __________________ __________________ __________________ __________________ __________ ___________ ________ _____________
SYS        EVOLVE-LOAD-FROM-AWR             30-MAY-20 11:50    30-JUL-20 23:34                       30-JUL-20 23:34    YES        NO          NO       YES
SYS        EVOLVE-LOAD-FROM-AWR             30-MAY-20 11:50    31-JUL-20 05:03                       31-JUL-20 05:03    YES        NO          NO       YES
SYS        EVOLVE-LOAD-FROM-CURSOR-CACHE    30-MAY-20 11:50    31-JUL-20 06:09                       31-JUL-20 06:09    YES        NO          NO       YES
SYS        EVOLVE-LOAD-FROM-AWR             30-MAY-20 11:50    31-JUL-20 06:09                       31-JUL-20 06:09    YES        NO          NO       YES
SYS        AUTO-CAPTURE                     30-MAY-20 16:08    31-JUL-20 07:15                       31-JUL-20 07:15    YES        NO          NO       YES
SYS        AUTO-CAPTURE                     30-MAY-20 19:10    30-MAY-20 19:30    30-MAY-20 19:30    30-MAY-20 19:29    YES        YES         NO       YES
SYS        AUTO-CAPTURE                     30-MAY-20 19:30    31-JUL-20 08:21                       31-JUL-20 08:21    YES        NO          NO       YES
SYS        AUTO-CAPTURE                     30-MAY-20 23:32    31-JUL-20 08:21                       31-JUL-20 08:21    YES        NO          NO       YES
SYS        AUTO-CAPTURE                     31-MAY-20 03:14    31-JUL-20 08:21                       31-JUL-20 08:21    YES        NO          NO       YES
SYS        AUTO-CAPTURE                     31-MAY-20 04:14    31-JUL-20 08:21                       31-JUL-20 08:21    YES        NO          NO       YES
SYS        EVOLVE-LOAD-FROM-AWR             31-MAY-20 13:04    31-JUL-20 23:43                       31-JUL-20 23:43    YES        NO          NO       YES
SYS        AUTO-CAPTURE                     31-MAY-20 13:19    31-JUL-20 23:43                       31-JUL-20 23:43    YES        NO          NO       YES
SYS        AUTO-CAPTURE                     31-MAY-20 13:39    11-JUL-20 04:35    11-JUL-20 04:35    31-MAY-20 14:09    YES        YES         NO       YES
SYS        AUTO-CAPTURE                     31-MAY-20 18:01    10-AUG-20 22:05                       10-AUG-20 22:05    YES        NO          NO       YES
SYS        AUTO-CAPTURE                     31-MAY-20 22:44    10-AUG-20 22:05                       10-AUG-20 22:05    YES        NO          NO       YES
SYS        AUTO-CAPTURE                     01-JUN-20 06:48    10-AUG-20 22:05                       10-AUG-20 22:05    YES        NO          NO       YES
SYS        AUTO-CAPTURE                     01-JUN-20 07:09    10-AUG-20 22:05                       10-AUG-20 22:05    YES        NO          NO       YES
SYS        AUTO-CAPTURE                     02-JUN-20 05:22    02-JUN-20 05:49                       02-JUN-20 05:49    YES        YES         NO       YES
SYS        AUTO-CAPTURE                     02-JUN-20 21:52    10-AUG-20 22:06                       10-AUG-20 22:06    YES        NO          NO       YES
SYS        AUTO-CAPTURE                     03-JUN-20 08:20    23-AUG-20 20:45    23-AUG-20 20:45    03-JUN-20 08:49    YES        YES         NO       YES
SYS        AUTO-CAPTURE                     04-JUN-20 01:34    10-AUG-20 22:06                       10-AUG-20 22:06    YES        NO          NO       YES
SYS        AUTO-CAPTURE                     05-JUN-20 21:43    10-AUG-20 22:06                       10-AUG-20 22:06    YES        NO          NO       YES
SYS        AUTO-CAPTURE                     14-JUN-20 06:01    18-AUG-20 23:22    18-AUG-20 23:22    14-JUN-20 10:52    YES        YES         NO       YES
SYS        AUTO-CAPTURE                     14-JUN-20 06:21    13-AUG-20 22:35                       13-AUG-20 22:35    YES        NO          NO       YES
SYS        AUTO-CAPTURE                     27-JUN-20 16:43    27-AUG-20 22:11                       27-AUG-20 22:11    YES        NO          NO       YES
SYS        AUTO-CAPTURE                     28-JUN-20 02:09    28-JUN-20 06:52    28-JUN-20 06:52    28-JUN-20 06:41    YES        YES         NO       YES
SYS        AUTO-CAPTURE                     28-JUN-20 08:13    29-JUL-20 23:24                       29-JUL-20 23:24    YES        NO          NO       YES
SYS        AUTO-CAPTURE                     29-JUN-20 03:05    30-JUL-20 22:28                       30-JUL-20 22:28    YES        NO          NO       YES
SYS        AUTO-CAPTURE                     29-JUN-20 10:50    30-JUL-20 23:33                       30-JUL-20 23:33    YES        NO          NO       YES
SYS        AUTO-CAPTURE                     30-JUN-20 13:28    11-JUL-20 05:15    11-JUL-20 05:15    30-JUN-20 23:09    YES        YES         NO       YES
SYS        AUTO-CAPTURE                     01-JUL-20 14:04    31-JUL-20 22:37                       31-JUL-20 22:37    YES        NO          NO       YES
SYS        AUTO-CAPTURE                     11-JUL-20 06:36    10-AUG-20 22:07                       10-AUG-20 22:07    YES        NO          NO       YES
SYS        AUTO-CAPTURE                     11-JUL-20 14:00    11-AUG-20 22:06                       11-AUG-20 22:06    YES        NO          NO       YES
SYS        AUTO-CAPTURE                     12-JUL-20 00:47    11-AUG-20 22:06                       11-AUG-20 22:06    YES        NO          NO       YES
SYS        AUTO-CAPTURE                     12-JUL-20 01:47    11-AUG-20 22:06                       11-AUG-20 22:06    YES        NO          NO       YES
SYS        AUTO-CAPTURE                     12-JUL-20 09:52    13-AUG-20 22:34                       13-AUG-20 22:34    YES        NO          NO       YES
SYS        AUTO-CAPTURE                     13-JUL-20 04:03    13-AUG-20 22:34                       13-AUG-20 22:34    YES        NO          NO       YES
SYS        AUTO-CAPTURE                     18-JUL-20 12:15    17-AUG-20 22:15                       17-AUG-20 22:15    YES        NO          NO       YES
SYS        AUTO-CAPTURE                     18-JUL-20 23:43    18-AUG-20 22:44                       18-AUG-20 22:44    YES        NO          NO       YES
SYS        AUTO-CAPTURE                     24-JUL-20 01:38    23-AUG-20 06:24                       23-AUG-20 06:24    YES        NO          NO       YES
SYS        AUTO-CAPTURE                     24-JUL-20 06:42    24-AUG-20 22:09                       24-AUG-20 22:09    YES        NO          NO       YES
SYS        AUTO-CAPTURE                     30-JUL-20 02:21    30-JUL-20 02:41                       30-JUL-20 02:41    YES        NO          NO       YES
SYS        AUTO-CAPTURE                     07-AUG-20 18:33    07-AUG-20 19:16                       07-AUG-20 19:16    YES        NO          NO       YES
SYS        AUTO-CAPTURE                     13-AUG-20 22:52    14-AUG-20 22:10                       14-AUG-20 22:10    YES        NO          NO       YES
SYS        AUTO-CAPTURE                     14-AUG-20 05:16    14-AUG-20 22:10                       14-AUG-20 22:10    YES        NO          NO       YES
SYS        AUTO-CAPTURE                     14-AUG-20 15:42    14-AUG-20 22:10                       14-AUG-20 22:10    YES        NO          NO       YES
SYS        AUTO-CAPTURE                     18-AUG-20 23:22    19-AUG-20 22:11                       19-AUG-20 22:11    YES        NO          NO       YES
SYS        AUTO-CAPTURE                     27-AUG-20 00:07    27-AUG-20 22:11                       27-AUG-20 22:11    YES        NO          NO       YES

Ok, there was a huge SQL Plan Management activity here. All starts on 30-MAY-20 and this is when my ATP database has been upgraded to 19c. 19c comes with two new features. First new feature is ā€œAutomatic SQL tuning setā€ which gathers a lot of statements in SYS_AUTO_STS as we have seen above. The other feature, ā€œAutomatic SQL Plan Managementā€, or ā€œAutomatic Resolution of Plan Regressionsā€ look into AWR for resource intensive statements with several execution plans. Then it create SQL Plan BAselines for them, loading all alternative plans that are found in AWR, SQL Tuning Sets, and Cursor Cache. And this is why I have EVOLVE-LOAD-FROM-AWR and EVOLVE-LOAD-FROM-CURSOR-CACHE loaded on 30-MAY-20 11:50
This feature is explained by Nigel Bayliss blog post.

So, here are the settings in the Autonomous Database, ALTERNATE_PLAN_BASELINE=AUTO which enables the Auto SPM and ALTERNATE_PLAN_SOURCE=AUTO which means: AUTOMATIC_WORKLOAD_REPOSITORY+CURSOR_CACHE+SQL_TUNING_SET


DEMO@atp1_tp> select parameter_name, parameter_value from   dba_advisor_parameters
              where  task_name = 'SYS_AUTO_SPM_EVOLVE_TASK' and parameter_value  'UNUSED' order by 1;

             PARAMETER_NAME    PARAMETER_VALUE
___________________________ __________________
ACCEPT_PLANS                TRUE
ALTERNATE_PLAN_BASELINE     AUTO
ALTERNATE_PLAN_LIMIT        UNLIMITED
ALTERNATE_PLAN_SOURCE       AUTO
DAYS_TO_EXPIRE              UNLIMITED
DEFAULT_EXECUTION_TYPE      SPM EVOLVE
EXECUTION_DAYS_TO_EXPIRE    30
JOURNALING                  INFORMATION
MODE                        COMPREHENSIVE
TARGET_OBJECTS              1
TIME_LIMIT                  3600
_SPM_VERIFY                 TRUE

This query (and explanations) are from Mike Dietrich blog post which you should read.

So, I can see many plans for this query, some accepted and some not. The Auto Evolve advisor task should help to see which plan is ok or not but it seems that it cannot for this statement:


SELECT DBMS_SPM.report_auto_evolve_task FROM   dual;
...

---------------------------------------------------------------------------------------------
 Object ID          : 848087
 Test Plan Name     : SQL_PLAN_gf2c99a3zrzsgd6c09b5e
 Base Plan Name     : Cost-based plan
 SQL Handle         : SQL_f709894a87fbff0f
 Parsing Schema     : SYS
 Test Plan Creator  : SYS
 SQL Text           : SELECT /*+dynamic_sampling(11) NO_XML_QUERY_REWRITE */
...

FINDINGS SECTION
---------------------------------------------------------------------------------------------

Findings (1):
-----------------------------
 1. This plan was skipped because either the database is not fully open or the
    SQL statement is ineligible for SQL Plan Management.

I dropped all those SQL Plan Baselines:


set serveroutput on
exec dbms_output.put_line ( DBMS_SPM.DROP_SQL_PLAN_BASELINE(sql_handle => 'SQL_f709894a87fbff0f') );

but the query is still long. The problem is not about the Auto SPM job which just tries to find a solution.

It seems that the Auto Index query spends time on this HASH GROUP BY because of the following:


     SELECT
...
     FROM
     (SELECT SQL_ID, PLAN_HASH_VALUE,MIN(ELAPSED_TIME) ELAPSED_TIME,MIN(EXECUTIONS) EXECUTIONS,MIN(OPTIMIZER_ENV) CE,
             MAX(EXISTSNODE(XMLTYPE(OTHER_XML),
                            '/other_xml/info[@type = "has_user_tab"]')) USER_TAB
       FROM
...       
     GROUP BY SQL_ID, PLAN_HASH_VALUE
     )
     WHERE USER_TAB > 0

This is the AI job looking at many statements, with their OTHER_XML plan information and doing a group by on that. There are probably no optimal plans for this query.

Them why do I have so many statements in the auto-captured SQL Tuning Set? An application should have a limited set of statements. In OLTP, with many executions for different values, we should use bind variables to limit the set of statements. In DWH, ad-hoc queries should have so many executions.

When looking at the statements not using bind variables, the FORCE_MATCHING_SIGNATURE is the right dimension on which to aggregates them as there are too many SQL_ID:


DEMO@atp1_tp> select force_matching_signature from dba_sqlset_statements group by force_matching_signature order by count(*) desc fetch first 2 rows only;

     FORCE_MATCHING_SIGNATURE
_____________________________
    7,756,258,419,218,828,704
   15,893,216,616,221,909,352

DEMO@atp1_tp> select sql_text from dba_sqlset_statements where force_matching_signature=15893216616221909352 fetch first 3 rows only;
                                                     SQL_TEXT
_____________________________________________________________
select FLAGS from SYS_FBA_TRACKEDTABLES where OBJ# = 50867
select FLAGS from SYS_FBA_TRACKEDTABLES where OBJ# = 51039
select FLAGS from SYS_FBA_TRACKEDTABLES where OBJ# = 51048

DEMO@atp1_tp> select sql_text from dba_sqlset_statements where force_matching_signature=7756258419218828704 fetch first 3 rows only;
                                                                                   SQL_TEXT
___________________________________________________________________________________________
select count(FA#) from SYS_FBA_TRACKEDTABLES where OBJ# = 51039 and bitand(FLAGS, 128)=0
select count(FA#) from SYS_FBA_TRACKEDTABLES where OBJ# = 51049 and bitand(FLAGS, 128)=0
select count(FA#) from SYS_FBA_TRACKEDTABLES where OBJ# = 51047 and bitand(FLAGS, 128)=0

I have two FORCE_MATCHING_SIGNATURE that have the most rows in DBA_SQLSET_STATEMENTS and looking at a sample of them confirms that they don’t use bind variables. They are oracle internal queries and because I have the FORCE_MATCHING_SIGNATURE I put it in a google search in order to see if others already have seen the issue (Oracle Support notes are also indexed by Google).

First result is a Connor McDonald blog post from 2016, taking this example to show how to hunt for SQL which should use bind variables:
https://connor-mcdonald.com/2016/05/30/sql-statements-using-literals/

There is also a hit on My Oracle Support for those queries:
5931756 QUERIES AGAINST SYS_FBA_TRACKEDTABLES DON’T USE BIND VARIABLES which is supposed to be fixed in 19c but obviously it is not. When I look at the patch I see ā€œwhere OBJ# = :1ā€ in ktfa.o


$ strings 15931756/files/lib/libserver18.a/ktfa.o | grep "SYS_FBA_TRACKEDTABLES where OBJ# = "
select count(FA#) from SYS_FBA_TRACKEDTABLES where OBJ# = :1 and bitand(FLAGS, :2)=0
select count(FA#) from SYS_FBA_TRACKEDTABLES where OBJ# = :1
select FLAGS from SYS_FBA_TRACKEDTABLES where OBJ# = :1

This uses bind variable.

But I checked in 19.6 and 20.3:


[oracle@cloud libserver]$ strings /u01/app/oracle/product/20.0.0/dbhome_1/bin/oracle | grep "SYS_FBA_TRACKEDTABLES where OBJ# = "
select count(FA#) from SYS_FBA_TRACKEDTABLES where OBJ# = %d and bitand(FLAGS, %d)=0
select count(FA#) from SYS_FBA_TRACKEDTABLES where OBJ# = %d
select FLAGS from SYS_FBA_TRACKEDTABLES where OBJ# = %d

This is string substitution. Not bind variable.

Ok, as usual, I went too far from my initial goal which was just sharing some screenshots about looking at Performance Hub. With the autonomous database we don’t have all tools we are used to. On a self-managed database I would have tkprof’ed this job that runs every 15 minutes. Different tools but still possible. In this example I drilled down the problematic query execution plan, found that a system table was too large, got the bug number that should be fixed and verified that it wasn’t.

If you want to drill down by yourself, I’m sharing one AWR report easy to download from the Performance Hub:
https://www.dropbox.com/s/vp8ndas3pcqjfuw/troubleshooting-autonomous-database-AWRReport.html
and PerfHub report gathered with dbms_perf.report_perfhub: https://www.dropbox.com/s/yup5m7ihlduqgbn/troubleshooting-autonomous-database-perfhub.html

Comments and questions welcome. If you are interested in an Oracle Performance Workshop tuning, I can do it in our office, customer premises or remotely (Teams, Teamviewer, or any tool you want). Just request it on: https://www.dbi-services.com/trainings/oracle-performance-tuning-training/#onsite. We can deliver a 3 days workshop on the optimizer concepts and hands-on lab to learn the troubleshooting method and tools. Or we can do some coaching looking at your environment on a shared screen: your database, your tools.

L’article Troubleshooting performance on Autonomous Database est apparu en premier sur dbi Blog.

↧

Upgrade to Oracle 19c – performance issue

$
0
0

In this blog I want to introduce you to a workaround for a performance issue which randomly appeared during the upgrades of several Oracle 12c databases to 19c I performed for a financial services provider. During the upgrades we ran into a severe performance issue after the upgrades of more than 40 databases had worked just fine. While most of them finished in less than one hour, we run into one which would have taken days to complete.

Issue

After starting the database upgrade from Oracle 12.2.0.1.0 to Production Version 19.8.0.0.0 the upgrade locked up during compiling:

@utlrp

Ā 

Reason

One select-statement on the unified_audit_trail was running for hours with no result, blocking the upgrade progress and consuming nearly all database resources. The size of the audit_trail itself was about 35MB, so not the size you would expect such a bottleneck from:

SQL> SELECT count(*) from gv$unified_audit_trail;

Ā 

Solution

After some research and testing (see notes below) I found the following workaround (after killing the upgrade process):

SQL> begin
DBMS_AUDIT_MGMT.CLEAN_AUDIT_TRAIL(
audit_trail_type => DBMS_AUDIT_MGMT.AUDIT_TRAIL_UNIFIED,
use_last_arch_timestamp => FALSE);
end;
/
SQL> set timing on;
SELECT count(*) from gv$unified_audit_trail;
exec DBMS_AUDIT_MGMT.FLUSH_UNIFIED_AUDIT_TRAIL;

Ā 

Note

As a first attempt I used the procedure below, described in Note 2212196.1.

But flush_unified_audit_trail lasted too long, so I killed the process after it ran for one hour. The flash procedure again worked fine after using clean_audit_trail as described above:

SQL> begin
DBMS_AUDIT_MGMT.FLUSH_UNIFIED_AUDIT_TRAIL;
for i in 1..10 loop
DBMS_AUDIT_MGMT.TRANSFER_UNIFIED_AUDIT_RECORDS;
end loop;
end;
/

Ā 

Ā 

A few days later we encountered the same issue on an Oracle 12.1.0.2 database which requires Patch 25985768 for executing dbms_audit_mgmt.transfer_unified_audit_records.

This procedure is available out of the box in the Oracle 12.2 database and in the Oracle 12.1.0.2 databases which have been patched with Patch 25985768.

To avoid to get caught in this trap it is my advise that you gather all relevant statistics before any upgrade from Oracle 12c to 19c and to query gv$unified_audit_trail in advance. This query usually finishes within a few seconds.

Ā 

Related documents

Doc ID 2212196.1

https://support.oracle.com/epmos/faces/DocumentDisplay?_afrLoop=257639407234852&id=2212196.1&_afrWindowMode=0&_adf.ctrl-state=rd4zvw12p_4

Master Note For Database Unified Auditing (Doc ID 2351084.1)

Bug 18920838 : 12C POOR QUERY PERFORMANCE ON DICTIONARY TABLE SYS.X$UNIFIED_AUDIT_TRAIL

Bug 21119008 : POOR QUERY PERFORMANCE ON UNIFIED_AUDIT_TRAIL

Performance Issues While Monitoring the Unified Audit Trail of an Oracle12c Database (Doc ID 2063340.1)

L’article Upgrade to Oracle 19c – performance issue est apparu en premier sur dbi Blog.

↧
↧

How to view and change SQL Server Agent properties with T-SQL queries

$
0
0

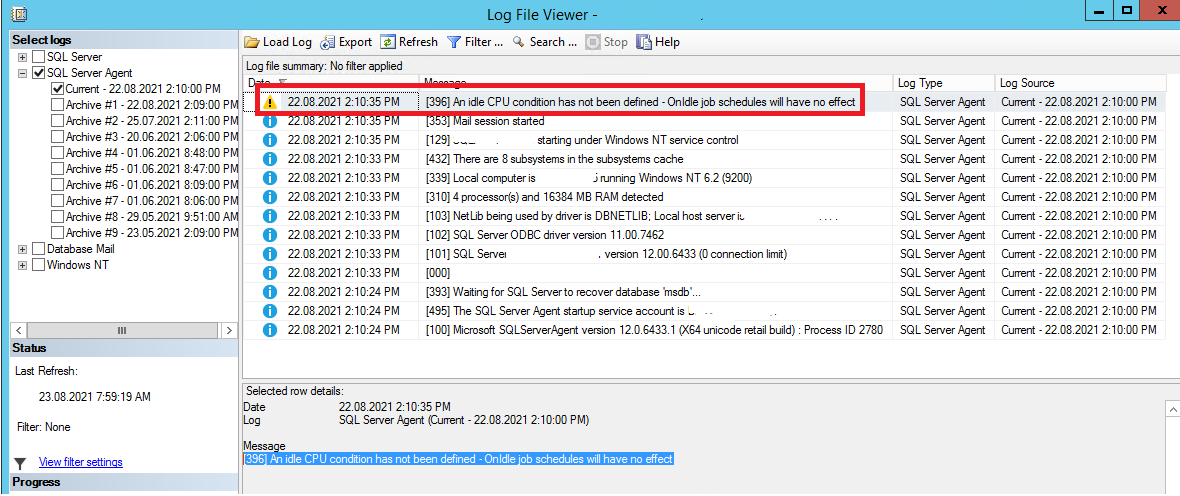
Few days ago, after a reboot, we had this warning on the Agent Error Logs on many servers:
Warning [396] An idle CPU condition has not been defined – OnIdle job schedules will have no effect

ā€œThe CPU idle definition influences how Microsoft SQL Server Agent responds to events. For example, suppose that you define the CPU idle condition as when the average CPU usage falls below 10 percent and remains at this level for 10 minutes. Then if you have defined jobs to execute whenever the server CPU reaches an idle condition, the job will start when the CPU usage falls below 10 percent and remains at that level for 10 minutes. ā€œ dixit Microsoft documentation here.
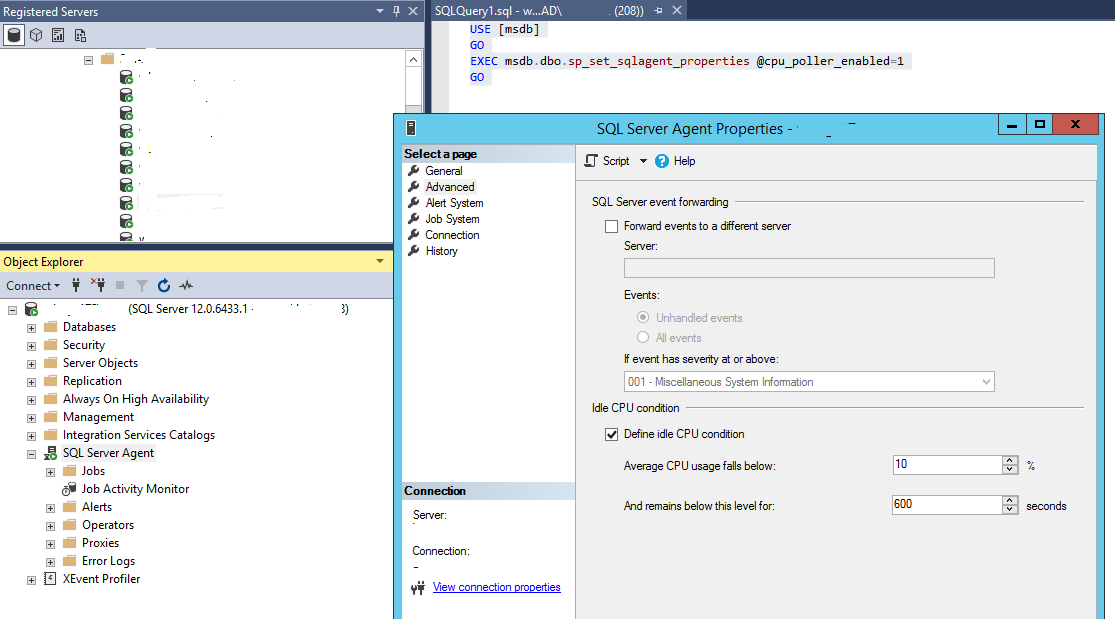
To resolve this warning, you need to go to the Agent Properties>Advanced and check ā€œDefine idle CPU conditionā€

The query used to check it is:

USE [msdb]
GO
EXEC msdb.dbo.sp_set_sqlagent_properties @cpu_poller_enabled=1
GO

With this issue, I will also give you some helpful queries to have a look on the Agent properties.
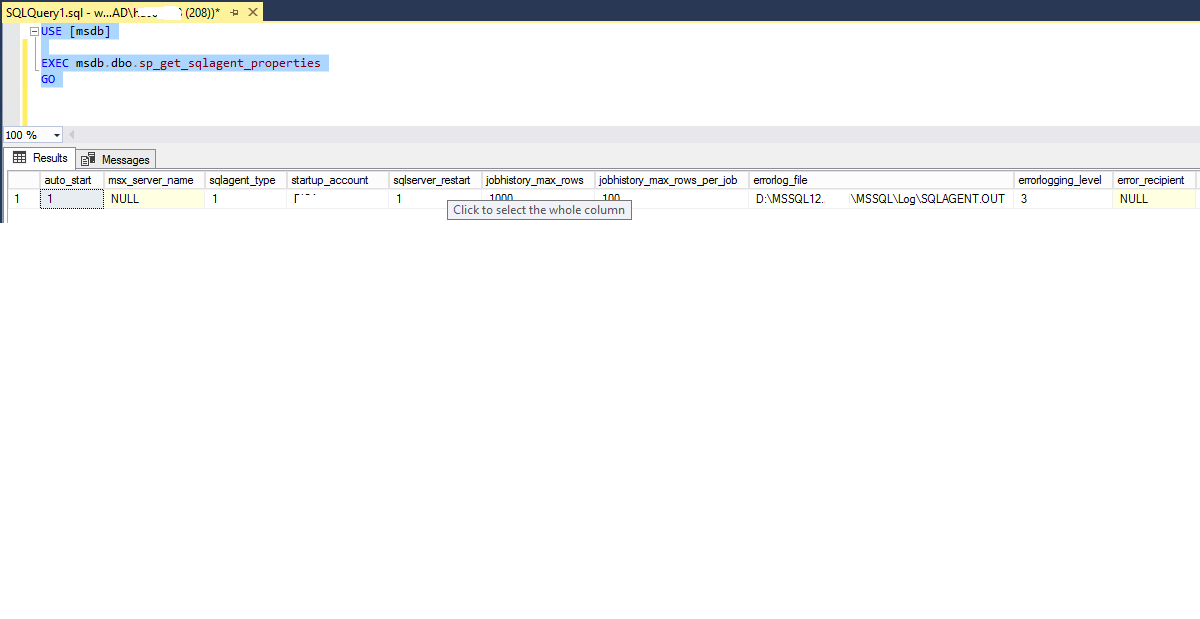
The best way to retrieve the information about the Agent properties is to use the Store Procedure: msdb.dbo.sp_get_sqlagent_properties

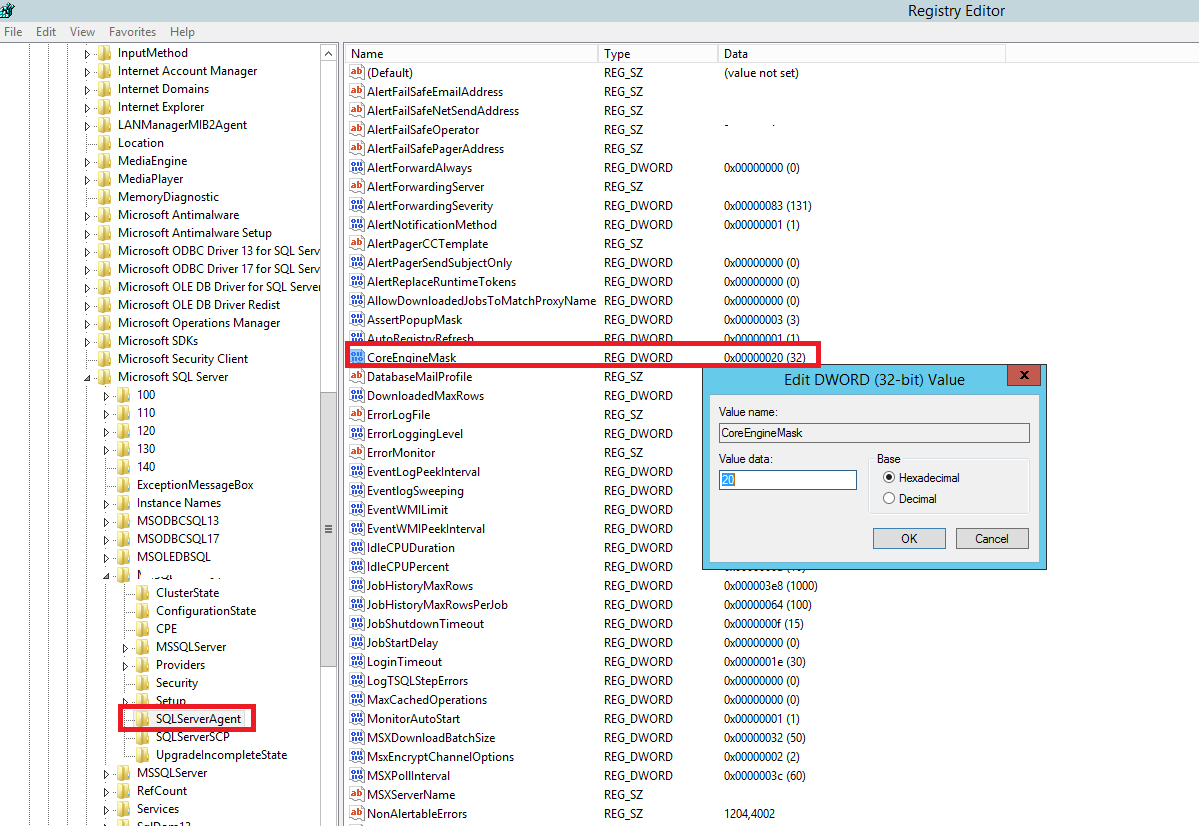
All information about the Agent Properties are in the Registry: HKEY_LOCAL_MACHINE\SOFTWARE\Microsoft\MSSQLServer\SQLServerAgent

You can of course read directly the value in the Registry with the query:

EXECUTE master.dbo.xp_instance_regread N'HKEY_LOCAL_MACHINE', N'SOFTWARE\Microsoft\MSSQLServer\SQLServerAgent',N' CoreEngineMask', @cpu_poller_enabled OUTPUT, N'no_output'

In my case the information is on the Value Name CoreEngineMask and to have the value, you need to do a filter like this:

IF (@cpu_poller_enabled IS NOT NULL)
SELECT @cpu_poller_enabled = CASE WHEN (@cpu_poller_enabled & 32) = 32 THEN 0 ELSE 1 END

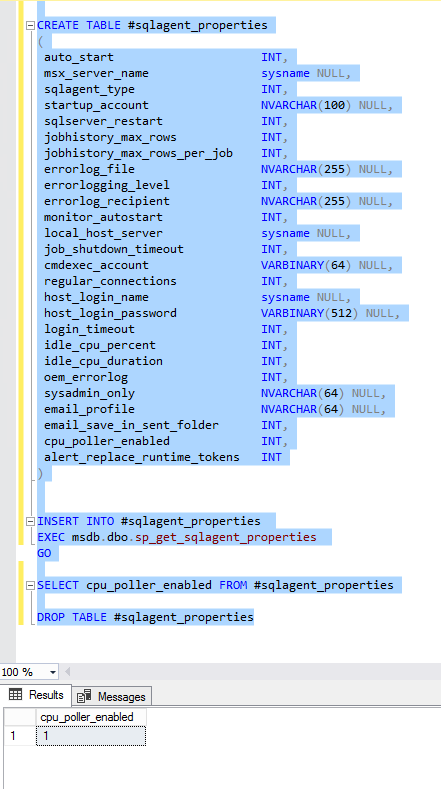
To finish this article, I will give you the query that I use to put the information from the Stored Procedure in a Table to retrieve the information that need more easily:

CREATE TABLE #sqlagent_properties
(
auto_start INT,
msx_server_name sysname NULL,
sqlagent_type INT,
startup_account NVARCHAR(100) NULL,
sqlserver_restart INT,
jobhistory_max_rows INT,
jobhistory_max_rows_per_job INT,
errorlog_file NVARCHAR(255) NULL,
errorlogging_level INT,
errorlog_recipient NVARCHAR(255) NULL,
monitor_autostart INT,
local_host_server sysname NULL,
job_shutdown_timeout INT,
cmdexec_account VARBINARY(64) NULL,
regular_connections INT,
host_login_name sysname NULL,
host_login_password VARBINARY(512) NULL,
login_timeout INT,
idle_cpu_percent INT,
idle_cpu_duration INT,
oem_errorlog INT,
sysadmin_only NVARCHAR(64) NULL,
email_profile NVARCHAR(64) NULL,
email_save_in_sent_folder INT,
cpu_poller_enabled INT,
alert_replace_runtime_tokens INT
)

INSERT INTO #sqlagent_properties
EXEC msdb.dbo.sp_get_sqlagent_properties
GO

SELECT cpu_poller_enabled FROM #sqlagent_properties

DROP TABLE #sqlagent_properties

I hope this can help you when you search the Agent Properties and want to change it on your SQL Server environment

L’article How to view and change SQL Server Agent properties with T-SQL queries est apparu en premier sur dbi Blog.

↧

ODA and KVM: Debugging of DBsystem creation failure

$
0
0

Debugging errors when working with ODA is not always the easiest thing do… šŸ˜›

It may become a bit tricky and not a straightforward process. In this blog I wanted to show you and example we faced with the debugging of a Dbsystem creation failure and how we found out the real reason it failed.

Before starting let’s do a short reminder about KVM virtualisation on ODA.

Since 19.9, ODA supports hard partitioning for database virtualisation on ODA. This works on a principle based on 2 types of VMs:

  1. Compute instance (more info here)
  2. DB Systems

While the first one is intended for traditional VM hosted any workload except oracle DBs, the second one is dedicated to database virtualisation.
A DB System is then an Oracle Linux with a similar stack than the ODAĀ  BM (GI, DB, …).

Provisioning a new DBSystem is pretty easy and straightforward using the command odaacli create-dbsystem and a JSON file as input…as long as it works…and you don’t do any mistake.

In our case, here the error we got when trying to create a new DB System:

Job details
----------------------------------------------------------------
                     ID:  75115716-4ce3-4eb1-af1a-4d3d8bef441a
            Description:  DB System srvdb01 creation
                 Status:  Failure
                Created:  November 5, 2021 11:37:48 AM CET
                Message:  DCS-10001:Internal error encountered: Error creating job 'Provision DB System 'srvdb01''.

Task Name                                Start Time                          End Time                            Status
---------------------------------------- ----------------------------------- ----------------------------------- ----------
Create DB System metadata                November 5, 2021 11:37:48 AM CET    November 5, 2021 11:37:48 AM CET    Success
Persist new DB System                    November 5, 2021 11:37:48 AM CET    November 5, 2021 11:37:48 AM CET    Success
Validate DB System prerequisites         November 5, 2021 11:37:48 AM CET    November 5, 2021 11:37:52 AM CET    Success
Setup DB System environment              November 5, 2021 11:37:52 AM CET    November 5, 2021 11:37:53 AM CET    Success
Create DB System ASM volume              November 5, 2021 11:37:53 AM CET    November 5, 2021 11:38:00 AM CET    Success
Create DB System ACFS filesystem         November 5, 2021 11:38:00 AM CET    November 5, 2021 11:38:09 AM CET    Success
Create DB System VM ACFS snapshots       November 5, 2021 11:38:09 AM CET    November 5, 2021 11:38:39 AM CET    Success
Create temporary SSH key pair            November 5, 2021 11:38:39 AM CET    November 5, 2021 11:38:39 AM CET    Success
Create DB System cloud-init config       November 5, 2021 11:38:39 AM CET    November 5, 2021 11:38:40 AM CET    Success
Provision DB System VM(s)                November 5, 2021 11:38:40 AM CET    November 5, 2021 11:38:41 AM CET    Success
Attach disks to DB System                November 5, 2021 11:38:41 AM CET    November 5, 2021 11:38:41 AM CET    Success
Add DB System to Clusterware             November 5, 2021 11:38:41 AM CET    November 5, 2021 11:38:41 AM CET    Success
Start DB System                          November 5, 2021 11:38:41 AM CET    November 5, 2021 11:38:44 AM CET    Success
Wait DB System VM first boot             November 5, 2021 11:38:44 AM CET    November 5, 2021 11:39:56 AM CET    Success
Setup Mutual TLS (mTLS)                  November 5, 2021 11:39:56 AM CET    November 5, 2021 11:40:15 AM CET    Success
Export clones repository                 November 5, 2021 11:40:15 AM CET    November 5, 2021 11:40:15 AM CET    Success
Setup ASM client cluster config          November 5, 2021 11:40:16 AM CET    November 5, 2021 11:40:18 AM CET    Success
Install DB System                        November 5, 2021 11:40:18 AM CET    November 5, 2021 11:40:26 AM CET    InternalError

So…it failed on installing DB into the newly creaated VM. Error code is: DCS-10001:Internal error

The first we tried is to get more info on this error code using dcserr:

[root@dbi-oda-x8 log]# dcserr 10001
10001, Internal_Error, "Internal error encountered: {0}."
// *Cause: An internal error occurred.
// *Action: Contact Oracle Support Services for assistance.
/

Not helping very much… Unfortunately the describe-job doesn’t give much more information about any kind of log file…

The only remaining solution is then to analyse the DCS log file. All operation we run using odacli are going through the dcsagent which generates a log in:

/opt/oracle/dcs/log

There you will find several types of log file such as the dcs-admin one or the dcs-components and obviously the dcs-agent log file

[root@dbi-oda-x8 log]# pwd
/opt/oracle/dcs/log
[root@dbi-oda-x8 log]# ls -l dcs-agent*
-rw-r--r-- 1 root root 144752279 Nov 3 23:30 dcs-agent-2021-11-03.log
-rw-r--r-- 1 root root 231235959 Nov 4 23:30 dcs-agent-2021-11-04.log
-rw-r--r-- 1 root root 151900 Nov 3 11:59 dcs-agent-requests-2021-11-03-03.log
-rw-r--r-- 1 root root 60331 Nov 3 12:59 dcs-agent-requests-2021-11-03-11.log
-rw-r--r-- 1 root root 122337 Nov 3 13:58 dcs-agent-requests-2021-11-03-13.log
-rw-r--r-- 1 root root 74029 Nov 3 14:59 dcs-agent-requests-2021-11-03-14.log
-rw-r--r-- 1 root root 112641 Nov 3 15:59 dcs-agent-requests-2021-11-03-15.log
-rw-r--r-- 1 root root 154503 Nov 3 16:59 dcs-agent-requests-2021-11-03-16.log
-rw-r--r-- 1 root root 10575 Nov 3 17:03 dcs-agent-requests-2021-11-03-17.log
-rw-r--r-- 1 root root 184 Nov 4 07:53 dcs-agent-requests-2021-11-04-07.log
-rw-r--r-- 1 root root 24097 Nov 4 08:42 dcs-agent-requests-2021-11-04-08.log
-rw-r--r-- 1 root root 6556 Nov 4 09:59 dcs-agent-requests-2021-11-04-09.log
-rw-r--r-- 1 root root 7711 Nov 4 10:56 dcs-agent-requests-2021-11-04-10.log
-rw-r--r-- 1 root root 17646 Nov 4 11:52 dcs-agent-requests-2021-11-04-11.log
-rw-r--r-- 1 root root 1837 Nov 4 12:58 dcs-agent-requests-2021-11-04-12.log
-rw-r--r-- 1 root root 122202 Nov 4 13:59 dcs-agent-requests-2021-11-04-13.log
-rw-r--r-- 1 root root 71837 Nov 4 14:59 dcs-agent-requests-2021-11-04-14.log
-rw-r--r-- 1 root root 215518 Nov 4 15:59 dcs-agent-requests-2021-11-04-15.log
-rw-r--r-- 1 root root 4497 Nov 4 16:24 dcs-agent-requests-2021-11-04-16.log
-rw-r--r-- 1 root root 660 Nov 5 07:56 dcs-agent-requests-2021-11-05-07.log
-rw-r--r-- 1 root root 513 Nov 5 08:00 dcs-agent-requests-2021-11-05-08.log
-rw-r--r-- 1 root root 45592 Nov 5 10:59 dcs-agent-requests-2021-11-05-10.log
-rw-r--r-- 1 root root 126945 Nov 5 11:59 dcs-agent-requests-2021-11-05-11.log
-rw-r--r-- 1 root root 17460 Nov 5 12:21 dcs-agent-requests.log
-rw-r--r-- 1 root root 75603907 Nov 5 12:21 dcs-agent.log

However the challenge is that this log file is pretty verbose and therefore pretty long.
Just to give you and idea, on our test ODA (where there were nothing much running) we had already almost 1 million rows in an half day.

So the option we used was to run a grep command to gather only the lines concerning the DB System we tried to create:

grep srvdb01 dcs-agent.log

…which still represents 850+ lines šŸ˜‰

Going bottom up, we found first all entries about the DELET DB SYSTEM we run after the failure, such as:

...
2021-11-05 11:47:50,962 INFO [dw-19811 - DELETE /dbsystem/srvdb01] [] c.o.d.a.k.o.l.SingleNodeLockController: Thread 'dw-19811 - DELETE /dbsystem/srvdb01' released READ lock for Resource type 'Metadata' with name 'metadata'
2021-11-05 11:47:50,963 INFO [dw-19811 - DELETE /dbsystem/srvdb01] [] c.o.d.a.k.m.KvmBaseModule: Starting new job 586fce36-8131-4f46-b447-36fab882f060 for taskFlow: seq(id: 586fce36-8131-4f46-b447-36fab882f060, name: 586fce36-8131-4f46-b447-36fab882f060, jobId: 586fce36-8131-4f46-b447-36fab882f060, status: Created,exposeTaskResultToJob: false, result: null, output: , on_failure: FailOnAny):
2021-11-05 11:47:50,963 INFO [dw-19811 - DELETE /dbsystem/srvdb01] [] c.o.d.a.k.m.KvmBaseModule: Job report: ServiceJobReport(jobId=586fce36-8131-4f46-b447-36fab882f060, status=Created, message=null, reports=[], createTimestamp=2021-11-05 11:47:50.957, resourceList=[], description=DB System srvdb01 deletion, updatedTime=2021-11-05 11:47:50.957)
  "description" : "DB System srvdb01 deletion",
  "description" : "DB System srvdb01 deletion",
2021-11-05 11:47:50,973 INFO [DeleteDbSystem_KvmLockContainer_38554 : JobId=586fce36-8131-4f46-b447-36fab882f060] [] c.o.d.a.k.o.l.SingleNodeLockController: Thread 'DeleteDbSystem_KvmLockContainer_38554 : JobId=586fce36-8131-4f46-b447-36fab882f060' trying to acquire WRITE lock for Resource type 'DB System' with name 'srvdb01'
2021-11-05 11:47:50,973 INFO [DeleteDbSystem_KvmLockContainer_38554 : JobId=586fce36-8131-4f46-b447-36fab882f060] [] c.o.d.a.k.o.l.SingleNodeLockController: Thread 'DeleteDbSystem_KvmLockContainer_38554 : JobId=586fce36-8131-4f46-b447-36fab882f060' acquired WRITE lock for Resource type 'DB System' with name 'srvdb01'
	 Mountpath: /u05/app/sharedrepo/srvdb01
...

So we could simply skip all lines containing DELET or Operation Type = Delete.

Then arrive plenty of lines which contains the error message you receive in the odacli describe-job as well as the content of the JSON file used to run the job.

...
2021-11-05 11:46:48,763 DEBUG [Process new DB System] [] c.o.d.a.k.t.KvmBaseTaskBuilder$KvmTaskExecutor: Output request: DbSystemCreateRequest(systemInfo=DbSystemCreateRequest.SystemInfo(dbSystemName=srvdb01, shapeName=odb2, cpuPoolName=cpupool4srv, diskGroup=DATA, systemPassword=*****, provisionType=rhp, timeZone=Europe/Zurich, enableRoleSeparation=true, customRoleSeparationInfo=DbSystemCreateRequest.CustomRoleSeparationInfo(groups=[DbSystemCreateRequest.GroupInfo(id=1001, role=oinstall, name=oinstall), DbSystemCreateRequest.GroupInfo(id=1002, role=dbaoper, name=dbaoper), DbSystemCreateRequest.GroupInfo(id=1003, role=dba, name=dba), DbSystemCreateRequest.GroupInfo(id=1004, role=asmadmin, name=asmadmin), DbSystemCreateRequest.GroupInfo(id=1005, role=asmoper, name=asmoper), DbSystemCreateRequest.GroupInfo(id=1006, role=asmdba, name=asmdba)], users=[DbSystemCreateRequest.UserInfo(id=1000, role=gridUser, name=grid), DbSystemCreateRequest.UserInfo(id=1001, role=oracleUser, name=oracle)])), networkInfo=DbSystemCreateRequest.NetworkInfo(domainName=dbi-lab.ch, ntpServers=[216.239.35.0], dnsServers=[8.8.8.8, 8.8.4.4], scanName=null, scanIps=null, nodes=[DbSystemCreateRequest.NetworkNodeInfo(number=0, name=srvdb01, ipAddress=10.36.0.245, netmask=255.255.255.0, gateway=10.36.0.1, vipName=null, vipAddress=null)], publicVNetwork=pubnet), gridInfo=DbSystemCreateRequest.GridInfo(language=en, enableAfd=false), dbInfo=DbSystemCreateRequest.DbInfo(name=srvTEST, uniqueName=srvTEST, domainName=dbi-lab.ch, adminPassword=**********, version=19.12.0.0.210720, edition=EE, type=SI, dbClass=OLTP, shape=odb2, role=PRIMARY, redundancy=MIRROR, characterSet=DbSystemCreateRequest.DbCharacterSetInfo(characterSet=AL32UTF8, nlsCharacterSet=AL16UTF16, dbTerritory=AMERICA, dbLanguage=ENGLISH), enableDbConsole=false, enableFlashStorage=false, enableFlashCache=false, enableSEHA=false, rmanBackupPassword=*****, level0BackupDay=null, tdePassword=*****, enableTde=false, enableUnifiedAuditing=true, isCdb=false, pdbName=null, pdbAdminUser=null, targetNodeNumber=null), devInfo=null)
2021-11-05 11:46:48,763 DEBUG [CreateDbSystem_KvmLockContainer_38327 : JobId=33793dd8-6704-407a-8dd0-f2b83a9deb10] [] c.o.d.c.t.TaskDetail: set task result as DCS-10001:Internal error encountered: Error creating job 'Provision DB System 'srvdb01''.
2021-11-05 11:46:48,763 INFO [CreateDbSystem_KvmLockContainer_38327 : JobId=33793dd8-6704-407a-8dd0-f2b83a9deb10] [] c.o.d.a.k.t.KvmBaseTaskBuilder$KvmLockContainer:  Task[id: CreateDbSystem_KvmLockContainer_38327, TaskName: CreateDbSystem_KvmLockContainer_38327] result: DCS-10001:Internal error encountered: Error creating job 'Provision DB System 'srvdb01''.
2021-11-05 11:46:48,763 DEBUG [33793dd8-6704-407a-8dd0-f2b83a9deb10 : JobId=33793dd8-6704-407a-8dd0-f2b83a9deb10] [] c.o.d.c.t.TaskDetail: set task result as DCS-10001:Internal error encountered: Error creating job 'Provision DB System 'srvdb01''.
2021-11-05 11:46:48,763 DEBUG [33793dd8-6704-407a-8dd0-f2b83a9deb10 : JobId=33793dd8-6704-407a-8dd0-f2b83a9deb10] [] c.o.d.a.k.m.i.KvmJobHelper$KvmTaskReportRecorder: Recording job report: id: 33793dd8-6704-407a-8dd0-f2b83a9deb10, name: 33793dd8-6704-407a-8dd0-f2b83a9deb10, jobId: 33793dd8-6704-407a-8dd0-f2b83a9deb10, status: Failure,exposeTaskResultToJob: false, result: DCS-10001:Internal error encountered: Error creating job 'Provision DB System 'srvdb01''., output:
  "message" : "DCS-10001:Internal error encountered: Error creating job 'Provision DB System 'srvdb01''.",
  "description" : "DB System srvdb01 creation",
  "message" : "DCS-10001:Internal error encountered: Error creating job 'Provision DB System 'srvdb01''.",
  "description" : "DB System srvdb01 creation",
...

Still not much useful…so we skipped these too and continue our journey upward. Finally looking for the first (going up) line without any error, we could found in the next one the following message:

2021-11-05 11:46:47,948 INFO [dw-18140 - GET /instances/storage/dgSpace/ALL] [] c.o.i.a.IDMAgentAuthorizer: IDMAgentAuthorizer::user:ODA-srvdb01:role:list-dgstorages
! Causing: com.oracle.dcs.commons.exception.DcsException: DCS-10001:Internal error encountered: Error creating job 'Provision DB System 'srvdb01''.
2021-11-05 11:46:48,745 DEBUG [Install DB System : JobId=33793dd8-6704-407a-8dd0-f2b83a9deb10] [] c.o.d.a.k.m.i.KvmJobHelper$KvmTaskReportRecorder: Recording task report: id: CreateDbSystem_KvmTask_38345,name: Install DB System, jobId: 33793dd8-6704-407a-8dd0-f2b83a9deb10, status: InternalError,exposeTaskResultToJob: false, result: DCS-10001:Internal error encountered: Error creating job 'Provision DB System 'srvdb01''.,output: DcsException{errorHttpCode=InternalError, msg=Internal error encountered: Error creating job 'Provision DB System 'srvdb01''., msgId=10001,causedBy=com.oracle.pic.commons.client.exceptions.RestClientException: DCS-11002:Password for database admin user does not comply with the password policy.}
  "taskResult" : "DCS-10001:Internal error encountered: Error creating job 'Provision DB System 'srvdb01''.",
  "taskResult" : "DCS-10001:Internal error encountered: Error creating job 'Provision DB System 'srvdb01''.",

Look at the 4th line šŸ˜‰ …yes at the end…scroll a bit more…here we go:

client.exceptions.RestClientException: DCS-11002:Password for database admin user does not comply with the password policy.}

Ā 

So finally the root cause of the failure was ā€œsimplyā€ that the password given for the sys/system accounts was not compliant… šŸ˜• šŸ˜•

However the remaining question is: Why don’t we get this error message back in the odacli describe-job instead of a useless generic error message??

It would have been so easier:

[root@dbi-oda-x8 log]# dcserr 11002
11002, Password_too_simple, "Password for {0} does not comply with the password policy."
// *Cause: The user provided password does not satisfy the password policy rules.
// *Action: Refer to the Deployment and User's Guide for the password policy.
//          Provide a password which meets the criteria.
/

I hope that this can help.

Enjoy! šŸ˜Ž

L’article ODA and KVM: Debugging of DBsystem creation failure est apparu en premier sur dbi Blog.

↧

How to delete a resource with the error: failed calling webhook

$
0
0

The original mistake

In preparation of the GitLab essentials workshop, I’m using helm to deploy it. After a few tests, I wanted to clean up my cluster, and accidentally deleted the namespace before doing helm uninstall. As a result, the namespace got stuck in the ā€œterminatingā€ state…

Troubleshooting

Now the namespace is stuck, but why ?

However, no resources seem to exist yet in the namespace:

rocky@gitlab-master1:dbi-gitlab-ws:~$ kubectl get all -n gitlab
> No resources found

By default, GitLab installs the cert-manager controller, which comes with CRDs. However, the get all command does not return the CRDs:

rocky@gitlab-master1:dbi-gitlab-ws:~$ kubectl get challenges.acme.cert-manager.io -n gitlab
NAME                                              STATE     DOMAIN                                   AGE
gitlab-gitlab-tls-c5nxj-1256604583-3239988248     invalid   gitlab-workshop.dbi-services.com     27m
gitlab-kas-tls-qghrb-3784695029-3983492218        invalid   kas-workshop.dbi-services.com        27m
gitlab-minio-tls-l8676-2620392232-3964581703      invalid   minio-workshop.dbi-services.com      27m
gitlab-registry-tls-k9j6n-1904257687-1249029966   invalid   registry-workshop.dbi-services.com   27m

CRDs delete does not work because the finalizer does not respond during deletion.

The easiest way to do this is to remove the finalizer from the resource:

rocky@gitlab-master1:dbi-gitlab-ws:~$ kubectl patch challenges.acme.cert-manager.io/gitlab-gitlab-tls-c5nxj-1256604583-3239988248 --type=json --patch='[ { "op": "remove", "path": "/metadata/finalizers" } ]' -n gitlab
> Error from server (InternalError): Internal error occurred: failed calling webhook "webhook.cert-manager.io": failed to call webhook: Post "https://gitlab-certmanager-webhook.gitlab.svc:443/mutate?timeout=10s": service "gitlab-certmanager-webhook" not found

Unfortunately, in this case, the patch doesn’t work because the delete of the namespace has removed some resources needed by the finalizer…

Solution

The cert-manager installs webhooks to manage CRDs:

rocky@gitlab-master1:dbi-gitlab-ws:~$ kubectl get ValidatingWebhookConfiguration
NAME                            WEBHOOKS   AGE
cert-manager-webhook            1          81m

rocky@gitlab-master1:dbi-gitlab-ws:~$ kubectl get MutatingWebhookConfiguration
NAME                         WEBHOOKS   AGE
gitlab-certmanager-webhook   1          81m

Webhooks call services and pods that no longer exist in our case. As a result, the webhook call fails and blocks the finalizer.

To correct the problem, simply delete the webhooks:

rocky@gitlab-master1:dbi-gitlab-ws:~$ kubectl delete ValidatingWebhookConfiguration cert-manager-webhook
rocky@gitlab-master1:dbi-gitlab-ws:~$ kubectl delete MutatingWebhookConfiguration gitlab-certmanager-webhook

After that, it is possible to delete the remaining CRDs:

rocky@gitlab-master1:dbi-gitlab-ws:~$ kubectl patch challenges.acme.cert-manager.io/gitlab-gitlab-tls-c5nxj-1256604583-3239988248 --type=json --patch='[ { "op": "remove", "path": "/metadata/finalizers" } ]' -n gitlab
> challenge.acme.cert-manager.io/gitlab-gitlab-tls-c5nxj-1256604583-3239988248 patched

The namespace will be automatically deleted once all CRDs have been cleaned.

L’article How to delete a resource with the error: failed calling webhook est apparu en premier sur dbi Blog.

↧

How I killed my M-Files instance…and brought it back to life!

$
0
0
Oops it's broken

I work with M-Files since 1 year now, and to be honest the solution is pretty robust.
I had really few issues at ā€œServer levelā€, but sooner and later while playing sorcerer’s apprentice you finish by breaking something.

The inevitable happened, my M-Files instance became unusable, I assume the root cause is a combination of several things:

  • First I instanced too many Vaults on an undersized VM.
  • Then I restarted (violently) the host while M-Files was still working on some Vaults (using embedded Firebird DBs).

As a result, impossible to launch the Admin console: infinite loading when I wanted to list the Vaults.
Same behavior with the Desktop client and the Web Interface.

My first and, naive thought was:

ā€œOK, I applied the last monthly update and it might be related to thatā€.

But no one is talking about this problem in the community….so I need to check for something else.

Then I checked the logs, and I found some events like:

M-Files database error

I was in a situation where the snake bites its tail, the problem is services cannot be stopped gracefully because some Vaults are not responding properly.
The admin tool is also not responding, I can’t bring the Vault offline neither run a ā€œVerify and Repairā€.

It’s unusual to say that, but one of the problems with M-Files’ stability is that there are very few resources (admin guide or community threads) that talk about troubleshooting and recovery.


How I fixed it

I had then to ā€œimproviseā€ and find a way to move back in a stable state.

  1. First I changed the M-Files services startup mode to ā€œManualā€ and I restarted the host.
  2. After the reboot, I moved all the folders with Vault data to a temporary location.
  3. I changed back the services startup mode to ā€œAutomaticā€ and started M-Files.
  4. I was able to access the Admin tool and list the Vault (all flagged Offline as folders are missing)
  5. I moved back the Vault folder one by one, bring the Vault online and run the ā€œVerify and Repairā€ on each.
  6. Some of the Vaults required to be fixed:
Vault inconsistency

Luckily it worked

it's fixed!

Finally my M-Files server is back with all the Vaults running and without having to restore any backup.

In conclusion

This mishap highlighted me one thing that may have an impact. My server is hosted in the Cloud and stopped during the night. I moved the backup schedules during evening hours when the server is still up, but I forgot to re-schedule the Maintenance activities when the VM is running.

But the most important thing is to point out that it took me a year before I encountered a major incident. I have worked on several ECMs in recent years, and I remain impressed by the stability of M-Files.

Feel free to contact us for any question about M-Files.

L’article How I killed my M-Files instance…and brought it back to life! est apparu en premier sur dbi Blog.

↧
↧

Oracle 21c: Attention Log – Useful or Superflous?

$
0
0

Attention.log is a feature, which was introduced in Oracle Database 21c, designed to capture high-level summaries of significant database events and activities. It differs from the alert.log in following points:

High-Level Summaries: The attention.log focuses on summarizing critical and significant events rather than logging every minor detail, including database startups and shutdowns, major configuration changes, errors or warnings that need immediate attention.

Consolidation of Critical Events: It provides a consolidated view of the most important events, making it easier for database administrators to quickly review and identify critical issues without rummaging through through detailed logs.

Accessibility: Designed to be easily readable and quickly accessible for a high-level overview of the database’s health and significant activities.

Complementary to Alert Log: While the attention.log highlights major events, it complements the alert.log rather than replacing it. Database administrators can use the attention.log for a quick overview and the alert.log for detailed diagnostics.

Location: Like the alert.log, the attention.log is also found in the DIAGNOSTIC_DEST directory, usually under $ORACLE_BASE/diag/rdbms/<db_name>/<instance_name>/log.

It can be very helpful for not so experienced database administrators or to get a quick overview in difficult or unexpected cases, as I had on a productive environment some time ago: an internal error had occurred, the database crashed and the alert.log was far too large to read without splitting it up which of course makes troubleshooting unnecessarily difficult (under time pressure).

How to get information about the attention.log:

The location of the attention log can be found by querying theĀ V$DIAG_INFOĀ view, it is in the same directory as the alert. log, (since Oracle 11g: $OH/diag/rdbms… )

select name, value
from   v$diag_info
where  name = 'Attention Log';

NAME                      VALUE
--------------------- -------------------------------------------------------------
Attention Log         /u01/app/oracle/diag/rdbms/cdb1/cdb1/trace/attention_cdb1.log

The oracle documentation proposes to query the V$DIAG_ALERT_EXT view to get relevant attention.log information, but it is a view over the XML-based alert.log (in the Automatic Diagnostic Repository for the current container), not the attention log! But nevertheless we can get very useful information out of it, divided into the same categories as in the attention.log:

--message_type 2=INCIDENT_ERROR, message_type 3=ERROR
SELECT message_type, message_level, message_text
FROM V$DIAG_ALERT_EXT 
WHERE message_type in (2, 3);

MESSAGE_TYPE MESSAGE_LEVEL MESSAGE_TEXT
------------ ------------- ---------------------------------------------------------
           3    4294967295 PMON (ospid: 3565): terminating the instance due to ORA error 471 

Querying V$DIAG_ALERT_EXT the most important labels are:

MESSAGE_LEVEL:

1:Ā CRITICAL: critical errors

2:Ā SEVERE: severe errors

8:Ā IMPORTANT: important message

16:Ā NORMAL: normal message

MESSAGE_TYPE:

1:Ā UNKNOWN: essentially the NULL type

2:Ā INCIDENT_ERROR: the program has encountered an error for some internal or unexpected reason, and it must be reported to Oracle Support

3:Ā ERROR: an error of some kind has occurred

4:Ā WARNING: an action occurred or a condition was discovered that should be reviewed and may require action

5:Ā NOTIFICATION: reports a normal action or event, this could be a user action such as ā€œlogon completedā€

6:Ā TRACE: output of a diagnostic trace

Opening the attention.log with vi

vi /u01/app/oracle/diag/rdbms/cdb1/cdb1/trace/attention_cdb1.log

will give you an output like this (JSON formatted), which is obviously pretty comfortable to read:

{
IMMEDIATE : "PMON (ospid: 3565): terminating the instance due to ORA error 471" 
CAUSE: "PMON detected fatal background process death"
ACTION: "Termination of fatal background is not recommended, Investigate cause of process termination"
CLASS : CDB-INSTANCE / CDB_ADMIN / ERROR / DBAL-35782660
TIME : 2024-07-10T14:15:16.159-07:00
INFO : "Some additional data on error PMON error"
}

It is possible to convert the output into plain text format:

jq -r '.tags[].name' input.json > output.txt

which gives us a formatted expression that might look like this:

2024-07-01T10:15:32.123456+00:00
[SEVERE] ORA-00600: internal error code, arguments: [1234], [], [], [], [], [], [], [], [], [], []
Action: Please contact Oracle Support Services.

2024-07-01T11:20:45.789012+00:00
[CRITICAL] ORA-01578: ORACLE data block corrupted (file # 23, block # 220734)
Action: This error signifies a corrupted data block. The data block has been marked as corrupt. Consider restoring from backup.

2024-07-02T08:42:27.654321+00:00
[ALERT] Database instance crashed due to unexpected termination.
Action: Investigate the cause of the instance termination. Review related logs and diagnostic information.

2024-07-03T12:34:56.987654+00:00
[INFO] System global area (SGA) resized. New size: 68GB.
Action: No immediate action required. Monitor performance and stability.

Key Points

Severity Levels: Entries are tagged with severity levels such as [SEVERE], [CRITICAL], [IMPORTANT] or [NORMAL] to highlight their importance.

Timestamp: Each entry begins with a timestamp in ISO 8601 format.

Messages and Actions: Each entry provides a brief description of the event and recommended actions.

Benefits for DBAs

Quick Identification: The attention.log helps DBAs quickly identify and respond to critical issues without sifting through the more detailed alert.log.

Conciseness: It captures only the most significant events, reducing noise and making it easier to focus on urgent matters.

Complementary to alert.log: It complements the alert.log by summarizing critical events, while the alert.log continues to provide detailed information for troubleshooting.

Overall, the attention.log is a useful addition for DBAs, enabling more efficient monitoring and quicker responses to significant database events.

https://oracle-base.com/articles/21c/attention-log-oracle-database-21c

https://blogs.oracle.com/cloud-infrastructure/post/alert-log-support-for-oci-database-management

https://docs.oracle.com/en/database/oracle/oracle-database/21/nfcon/management-solutions.html#GUID-F2EB58EC-4B22-473F-A2D3-40161372610E

L’article Oracle 21c: Attention Log – Useful or Superflous? est apparu en premier sur dbi Blog.

↧